by Calculated Risk on 8/01/2022 09:01:00 PM
Monday, August 01, 2022
Tuesday: Job Openings, Q2 Household Debt and Credit, Vehicle Sales

During the Fed's press conference last week, Powell reiterated what we thought we already knew about Fed policy and the bond market in general. Specifically, the next big-picture shift will be data dependent. In several ways, that narrative already began playing out in July. Now August is kicking things off in the same vein with a big drop in manufacturing inflation (via ISM's "prices paid" component) this morning. Bonds rallied after that to end the day at the best levels in months. [30 year fixed 5.05%]Tuesday:
emphasis added
• At 8:00 AM ET: Corelogic House Price index for June.
• At 10:00 AM ET: Job Openings and Labor Turnover Survey for June from the BLS.
• At 10:00 AM: the Q2 2022 Housing Vacancies and Homeownership from the Census Bureau.
• At 11:00 AM: NY Fed: Q2 Quarterly Report on Household Debt and Credit
• All Day: Light vehicle sales for July from the BEA. The consensus is for light vehicle sales to be 13.5 million SAAR in July, up from 13.0 million in June (Seasonally Adjusted Annual Rate).
On COVID (focus on hospitalizations and deaths):
Hospitalizations have almost quadrupled from the lows in April 2022.
 Click on graph for larger image.
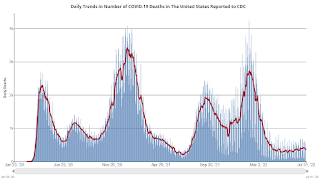
This graph shows the daily (columns) and 7-day average (line) of deaths reported.
| COVID Metrics | ||||
|---|---|---|---|---|
| Now | Week Ago | Goal | ||
| New Cases per Day2 | 114,021 | 127,727 | ≤5,0001 | |
| Hospitalized2 | 34,366 | 36,781 | ≤3,0001 | |
| Deaths per Day2 | 357 | 415 | ≤501 | |
| 1my goals to stop daily posts, 27-day average for Cases, Currently Hospitalized, and Deaths 🚩 Increasing 7-day average week-over-week for Cases, Hospitalized, and Deaths ✅ Goal met. | ||||
 Click on graph for larger image.
This graph shows the daily (columns) and 7-day average (line) of deaths reported.
Average daily deaths bottomed in July 2021 at 214 per day.


