If you were expecting August rail traffic to provide a definitive statement regarding the state of the economy, well, get used to disappointment. As in June and July, rail traffic in August was relatively evenly balanced between categories with carload gains and those with declines.
emphasis added
 Click on graph for larger image.
This graph from the Rail Time Indicators report shows the six-week average of U.S. Carloads in 2020, 2021 and 2022:
U.S. railroads originated an average of 237,978 total carloads per week in August 2022. That’s the best weekly average for any month since May 2021 and up 2.3% over August 2021. The 2.3% gain was the biggest year-over-year gain since February 2022 (which isn’t a fair comparison because rail traffic in February 2021 was decimated by severe winter storms).
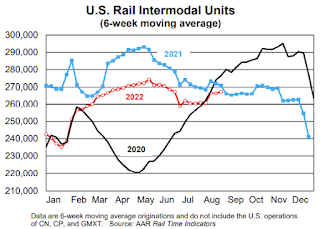
 The second graph shows the six-week average (not monthly) of U.S. intermodal in 2020, 2021 and 2022: (using intermodal or shipping containers):
Intermodal originations (which are not included in carloads) averaged 267,124 units per week in August 2022, down 1.2% from August 2021. August was the 12th decline in the past 13 months (February 2022 was the exception) but 1.2% is the smallest percentage decline in those 13 months. The weekly average in August 2022 was the third highest in the eight months so far this year. For the year to date through August, intermodal was down 5.1% from last year’s record, up 7.4% over 2020, and down 0.9% from 2019.