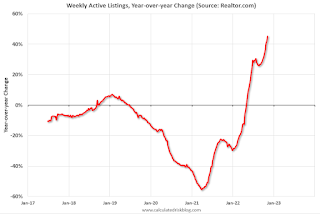
• Active inventory continued to grow, increasing 45% above one year ago. Inventory accelerated again, notching a fifth straight week of gains roughly at or above 2% after a fair amount of stability between July and September. Fewer newly listed homes would normally cause a decline in inventory, but buyers have retreated from the housing market as higher and more uncertain costs make it difficult to ascertain purchasing power and set a budget.
...
• New listings–a measure of sellers putting homes up for sale–were again down, dropping 18% from one year ago. This marks the nineteenth week of year over year declines in homeowners listing their home for sale, a tangible reflection of the ongoing decline in seller confidence. Because potential sellers have pulled back so significantly, prices are decelerating in a more modest fashion than might otherwise be the case.
 Here is a graph of the year-over-year change in inventory according to realtor.com.
 Note the rapid increase in the YoY change earlier this year, from down 30% at the beginning of the year, to up 29% YoY at the beginning of July.
Then the Realtor.com data was stuck at up around 26% to 30% YoY for 14 weeks in a row. This was due to the slowdown in new listings, even as sales had fallen sharply.
Now YoY inventory is increasing again with even higher mortgage rates, suggesting sales are off more than new listings.