by Calculated Risk on 1/13/2023 02:08:00 PM
Friday, January 13, 2023
Question #1 for 2023: How much will the economy grow in 2023? Will there be a recession in 2023?
Earlier I posted some questions on my blog for next year: Ten Economic Questions for 2023. Some of these questions concern real estate (inventory, house prices, housing starts, new home sales), and I’ll post thoughts on those in the newsletter (others like GDP and employment will be on this blog).
I'm adding some thoughts, and maybe some predictions for each question.
1) Economic growth: Economic growth was probably close to 1% in 2022 as the economy slowed following the economic rebound in 2021. The FOMC is expecting growth of just 0.4% to 1.0% Q4-over-Q4 in 2023. How much will the economy grow in 2023? Will there be a recession in 2023?
In December I went on "recession watch", for only the 3rd time in the 18 years that I've been writing this blog, but I noted I didn't see a recession coming yet. The other two times were in early 2007 (housing bust), and in March 2020 (pandemic).
Here are the Ten Economic Questions for 2023 and a few predictions:The FOMC is forecasting an employment recession, and many Wall Street analysts are forecasting an economic recession in 2023. BofA is forecasting GDP will contract 0.3% in 2023. In addition, the Congress is threatening to shut down the government in October and - more worrisome - default on the US debt. Defaulting on the debt with an already weak economy will likely push the economy into recession.
Two key leading indicators are suggesting recession in 2023.
 One of the leading indicators for recessions is the yield curve. Here is a graph of 10-Year Treasury Constant Maturity Minus 2-Year Treasury Constant Maturity from FRED.
Click here for interactive graph at FRED.
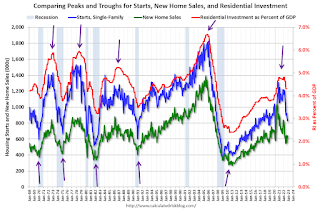
 The arrows point to some of the earlier peaks and troughs for these three measures - and the most recent peak.
New home sales and single-family starts turned down last year, but that was partly due to the huge surge in sales during the pandemic - and then rebounded somewhat. Now both new home sales and single-family starts have turned down in response to higher mortgage rates. Residential investment has also peaked.
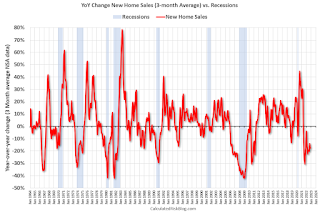
 This third graph shows the YoY change in New Home Sales from the Census Bureau. Currently new home sales (based on 3-month average) are down 18% year-over-year.
 One of the leading indicators for recessions is the yield curve. Here is a graph of 10-Year Treasury Constant Maturity Minus 2-Year Treasury Constant Maturity from FRED.
Click here for interactive graph at FRED.
When the yield curve turns negative - the 2-year yields more than the 10-year - that suggests investors think interest rates will decline, usually indicating a coming recession. However, economist Campbell Harvey (yield curve inventor) notes:
My yield-curve indicator has gone Code Red. It is 8 for 8 in forecasting recessions since 1968 —with no false alarms. I have reasons to believe, however, that it is flashing a false signal.One of my favorite models for business cycle forecasting uses new home sales (also housing starts and residential investment). The purpose of the mext graph is to show that these three indicators generally reach peaks and troughs together. Note that Residential Investment is quarterly and single-family starts and new home sales are monthly.
...
The yield curve has now inverted for a ninth time since 1968. Does it spell doom? I am not so sure.
...
These circumstances raise the possibility of dodging the bullet. Ideally, we avoid the hard-landing recession and realize slow growth or minor negative growth. If a recession arrives, it will be mild.
The major wildcard is the Fed, who was late in raising rates. The Fed cannot err twice by overshooting-i.e., continuing to increase rates well beyond when they should have stopped. I believe the time to end the tightening is now.
 The arrows point to some of the earlier peaks and troughs for these three measures - and the most recent peak.
New home sales and single-family starts turned down last year, but that was partly due to the huge surge in sales during the pandemic - and then rebounded somewhat. Now both new home sales and single-family starts have turned down in response to higher mortgage rates. Residential investment has also peaked.
 This third graph shows the YoY change in New Home Sales from the Census Bureau. Currently new home sales (based on 3-month average) are down 18% year-over-year.
Usually when the YoY change in New Home Sales falls about 20%, a recession will follow. An exception for this data series was the mid '60s when the Vietnam buildup kept the economy out of recession. Another exception was in late 2021 - we saw a significant YoY decline in new home sales related to the pandemic and the surge in new home sales in the second half of 2020. I ignored that pandemic distortion. Also note that the sharp decline in 2010 was related to the housing tax credit policy in 2009 - and was just a continuation of the housing bust.
Here is a table of the annual change in real GDP since 2005. Prior to the pandemic, economic activity was mostly in the 2% range since 2010. Given current demographics, that is about what we'd expect: See: 2% is the new 4%..
Note: This table includes both annual change and q4 over the previous q4 (two slightly different measures). For 2022, I used a 2.6% annual growth rate in Q4 2022 (this gives -2.2% Q4 over Q4 or -3.4% real annual growth). This is based on Goldman Sachs estimate: "We left our Q4 GDP tracking estimate unchanged at +2.6% (qoq ar)."
My sense is growth will stay sluggish in 2023, but the economy will avoid recession. Although monetary policy is restrictive, the fiscal policy drag is probably over. Vehicle sales will probably pick up in 2023, but housing will stay low.
Here is a table of the annual change in real GDP since 2005. Prior to the pandemic, economic activity was mostly in the 2% range since 2010. Given current demographics, that is about what we'd expect: See: 2% is the new 4%..
Note: This table includes both annual change and q4 over the previous q4 (two slightly different measures). For 2022, I used a 2.6% annual growth rate in Q4 2022 (this gives -2.2% Q4 over Q4 or -3.4% real annual growth). This is based on Goldman Sachs estimate: "We left our Q4 GDP tracking estimate unchanged at +2.6% (qoq ar)."
| Real GDP Growth | ||
|---|---|---|
| Year | Annual GDP | Q4 / Q4 |
| 2005 | 3.5% | 3.0% |
| 2006 | 2.8% | 2.6% |
| 2007 | 2.0% | 2.2% |
| 2008 | 0.1% | -2.5% |
| 2009 | -2.6% | 0.1% |
| 2010 | 2.7% | 2.8% |
| 2011 | 1.5% | 1.5% |
| 2012 | 2.3% | 1.6% |
| 2013 | 1.8% | 2.5% |
| 2014 | 2.3% | 2.6% |
| 2015 | 2.7% | 1.9% |
| 2016 | 1.7% | 2.0% |
| 2017 | 2.2% | 2.8% |
| 2018 | 2.9% | 2.3% |
| 2019 | 2.3% | 2.6% |
| 2020 | -2.8% | -1.5% |
| 2021 | 5.9% | 5.7% |
| 20221 | 2.0% | 0.9% |
| 1 2022 estimate based on 2.6% Q4 SAAR annualized real growth rate. | ||
My sense is growth will stay sluggish in 2023, but the economy will avoid recession. Although monetary policy is restrictive, the fiscal policy drag is probably over. Vehicle sales will probably pick up in 2023, but housing will stay low.
My guess is that real GDP growth will probably be positive in the 1.0% range in 2023 with downside risk if the FOMC overtightens or Congress forces a debt default. Since two of the best leading indicators are suggesting a recession, I'll stay on recession watch, and I might change my view on a recession in 2023.
• Question #1 for 2023: How much will the economy grow in 2023? Will there be a recession in 2023?
• Question #2 for 2023: How much will job growth slow in 2023? Or will the economy lose jobs?
• Question #3 for 2023: What will the unemployment rate be in December 2023?
• Question #4 for 2023: What will the participation rate be in December 2023?
• Question #5 for 2023: What will the YoY core inflation rate be in December 2023?
• Question #6 for 2023: What will the Fed Funds rate be in December 2023?
• Question #7 for 2023: How much will wages increase in 2023?
• Question #8 for 2023: How much will Residential investment change in 2023? How about housing starts and new home sales in 2023?
• Question #9 for 2023: What will happen with house prices in 2023?
• Question #10 for 2023: Will inventory increase further in 2023?


