by Calculated Risk on 5/30/2023 09:30:00 AM
Tuesday, May 30, 2023
Case-Shiller: National House Price Index increased 0.7% year-over-year in March
S&P/Case-Shiller released the monthly Home Price Indices for March ("March" is a 3-month average of January, February and March closing prices).
This release includes prices for 20 individual cities, two composite indices (for 10 cities and 20 cities) and the monthly National index.
From CNBC Home price declines may be over, S&P Case-Shiller says
Nationally, home prices in March were 0.7% higher than March 2022, the S&P CoreLogic Case-Shiller Indices said Tuesday.
“The modest increases in home prices we saw a month ago accelerated in March 2023,” said Craig J. Lazzara, managing director at S&P DJI in a release. “Two months of increasing prices do not a definitive recovery make, but March’s results suggest that the decline in home prices that began in June 2022 may have come to an end.”
The 10-city composite, which includes the Los Angeles and New York metropolitian areas, dropped 0.8% year over year, compared with a 0.5% increase in the previous month. The 20-city composite, which includes Dallas-Fort Worth and the Detroit area, fell 1.1%, down from a 0.4% annual gain in the previous month.
emphasis added
 Click on graph for larger image.
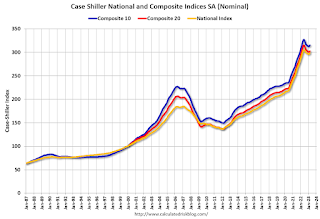
 The first graph shows the nominal seasonally adjusted Composite 10, Composite 20 and National indices (the Composite 20 was started in January 2000).
The Composite 10 index is up 0.6% in March (SA) and down 3.6% from the recent peak in June 2022.
The Composite 20 index is up 0.5% (SA) in March and down 4.0% from the recent peak in June 2022.
The National index is up 0.4% (SA) in March and is down 2.2% from the peak in June 2022.
 The second graph shows the year-over-year change in all three indices.
The Composite 10 SA is down 0.8% year-over-year. The Composite 20 SA is down 1.1% year-over-year.
The National index SA is up 0.7% year-over-year.
Annual price increases were below expectations. I'll have more later.


