Mortgage applications increased 0.5 percent from one week earlier, according to data from the Mortgage Bankers Association’s (MBA) Weekly Mortgage Applications Survey for the week ending June 16, 2023.
The Market Composite Index, a measure of mortgage loan application volume, increased 0.5 percent on a seasonally adjusted basis from one week earlier. On an unadjusted basis, the Index decreased 1 percent compared with the previous week. The Refinance Index decreased 2 percent from the previous week and was 40 percent lower than the same week one year ago. The seasonally adjusted Purchase Index increased 2 percent from one week earlier. The unadjusted Purchase Index decreased 0.1 percent compared with the previous week and was 32 percent lower than the same week one year ago.
“The 30-year fixed mortgage rate declined for the third consecutive week to 6.73 percent, while other mortgage rates saw mixed results. Purchase applications increased, driven by a 2 percent gain in conventional purchase applications and a 3 percent increase in FHA purchase activity,” said Joel Kan, MBA’s Vice President and Deputy Chief Economist. “First-time homebuyers account for a large share of FHA purchase loans, and this increase is a sign that while buyer interest is there, activity continues to be constrained by low levels of affordable inventory. Refinance applications continued their decline after the previous week’s increase, with the refinance share of applications just below 27 percent.”
Added Kan, “The rate for jumbo loans exceeded the conforming rate for the second straight week – the last time jumbo rates were higher was in December 2021.Tighter liquidity conditions have prompted jumbo lenders to pull back, increasing rates in the process.
...
The average contract interest rate for 30-year fixed-rate mortgages with conforming loan balances ($726,200 or less) decreased to 6.73 percent from 6.77 percent, with points decreasing to 0.64 from 0.65 (including the origination fee) for 80 percent loan-to-value ratio (LTV) loans.
emphasis added
 Click on graph for larger image.
The first graph shows the MBA mortgage purchase index.
According to the MBA, purchase activity is down 32% year-over-year unadjusted.
Red is a four-week average (blue is weekly). This is close to the lowest level since the mid 1990s.

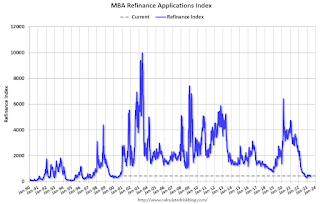
The second graph shows the refinance index since 1990.
With higher mortgage rates, the refinance index declined sharply in 2022 - and has mostly flat lined at a low level since then.