by Calculated Risk on 7/19/2023 12:21:00 PM
Wednesday, July 19, 2023
AIA: Architecture Billings "Stable" in June; Multi-family Billings Decline for 11th Consecutive Month
Note: This index is a leading indicator primarily for new Commercial Real Estate (CRE) investment.
From the AIA: AIA/Deltek Architecture Billings Index Stable in June
Architecture firms reported flat billings in June, according to the latest Architecture Billings Index (ABI) from the American Institute of Architects (AIA) and Deltek.
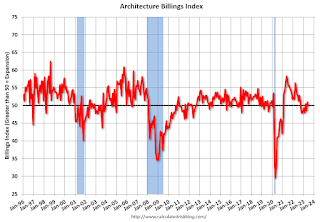
The ABI score of 50.1 for the month indicates that billings at architecture firms remained steady as design activity continues to slowly recover from roiled economic conditions. This also marks the first time since last fall that there have been two consecutive months of scores above 50, although growth in June was weaker than May (any score above 50 indicates an increase in firm billings).
“It is encouraging to see two consecutive months of stability in billings after a couple quarters of weakness due to high inflation, rising interest rates, and increased construction costs,” said AIA Chief Economist Kermit Baker, PhD, Hon. AIA. “We are still facing some headwinds in the broader economy, but this respite suggests that market conditions may be finding firmer ground.”
Firms located in the Midwest continue to report the strongest billings for the eighth consecutive month, while firms in nearly all regions of the country also reported improving business conditions in June. Firms also reported that inquiries into new projects fell slightly from 57.2 to 56.7 the previous month. Further, the value of new design contracts edged up to 52.7 in June from 52.3 in May.
Firm backlogs have decreased from their record-high levels in 2022 but remain robust at an average of 6.8 months.
...
• Regional averages: Midwest (52.4); Northeast (50.6); South (50.5); West (48.6)
• Sector index breakdown: institutional (55.4); mixed practice (firms that do not have at least half of their billings in any one other category) (48.8); commercial/industrial (47.8); multi-family residential (47.4)
emphasis added
 Click on graph for larger image.
This graph shows the Architecture Billings Index since 1996. The index was at 50.1 in June, down from 51.0 in May. Anything above 50 indicates an increase in demand for architects' services.
Note: This includes commercial and industrial facilities like hotels and office buildings, multi-family residential, as well as schools, hospitals and other institutions.
This index has declined in 6 of the last 9 months. This index usually leads CRE investment by 9 to 12 months, so this index suggests a slowdown in CRE investment later in 2023 and into 2024.
Note that multi-family billing turned down in August 2022 and has been negative for ELEVEN consecutive months (with revisions). This suggests we will see a further downturn in multi-family starts this year.


