by Calculated Risk on 9/27/2023 04:13:00 PM
Wednesday, September 27, 2023
A few comments on the Seasonal Pattern for House Prices
Two key points:
1) There is a clear seasonal pattern for house prices.
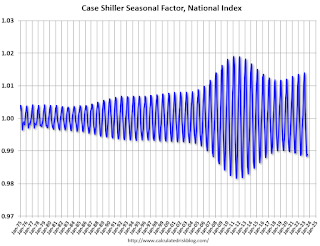
2) The surge in distressed sales during the housing bust distorted the seasonal pattern. This was because distressed sales (at lower price points) happened at a steady rate all year, while regular sales followed the normal seasonal pattern. This made for larger swings in the seasonal factor during the housing bust.

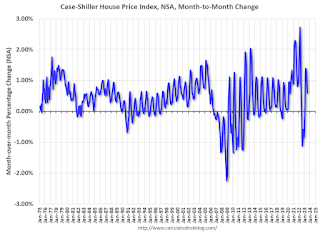
This graph shows the month-to-month change in the NSA Case-Shiller National index since 1987 (through July 2023). The seasonal pattern was smaller back in the '90s and early '00s and increased once the bubble burst.
The seasonal swings declined following the bust, however the more recent price surge changed the month-over-month pattern.

The swings in the seasonal factors were decreasing following the bust but have increased again recently - this time without a surge in distressed sales.


