by Calculated Risk on 10/06/2023 05:49:00 PM
Friday, October 06, 2023
AAR: September Rail Carloads and Intermodal Increased Year-over-year
From the Association of American Railroads (AAR) Rail Time Indicators. Graphs and excerpts reprinted with permission.
As is usually the case, in September some rail sectors did better than others. There were clearly some good signs.
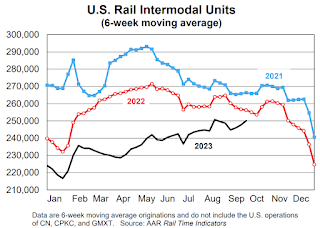
For example, U.S. intermodal originations in September 2023 averaged 252,224 containers and trailers per week, the most for any month since October 2022. August, September, and October are typically the highest-volume U.S. intermodal months, reflecting “peak season” shipments ahead of the holidays. In September, intermodal originations were up 0.7% over last year, just their second increase in 26 months. ...
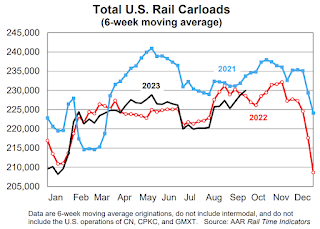
Total carloads on U.S. railroads in September 2023 were up 2.3% over September 2022, their first increase in four months and their biggest percentage gain since January 2023. Total carloads averaged 230,429 per week in September 2023, the most since October 2022. Year-to-date total carloads were up 0.3% over 2022 and up 0.7% over 2021
emphasis added
 Click on graph for larger image.
This graph from the Rail Time Indicators report shows the six-week average of U.S. Carloads in 2021, 2022 and 2022:
U.S. railroads originated 921,716 total carloads in September 2023, up 2.3% (20,754 carloads) over September 2022. That’s the first year-over-year increase for total carloads in four months and the biggest percentage increase since January 2023. Total carloads averaged 230,429 per week in September 2023, the most since October 2022. Intermodal isn’t included in carloads.
 The second graph shows the six-week average (not monthly) of U.S. intermodal in 2021, 2022 and 2023: (using intermodal or shipping containers):
U.S. intermodal originations were up 0.7% in September 2023 over September 2022. That’s just the second year-over-year increase for intermodal since July 2021, a span of 26 months. (The other increase, in February 2022 over February 2021, shouldn’t count because it was a function of severe ice storms in February 2021 that caused an easy comparison when February 2022 came along.) U.S. intermodal volume in September 2023 averaged 252,224 containers and trailers per week, the most for any month since October 2022.


