Mortgage applications increased 0.6 percent from one week earlier, according to data from the Mortgage Bankers Association’s (MBA) Weekly Mortgage Applications Survey for the week ending October 6, 2023.
The Market Composite Index, a measure of mortgage loan application volume, increased 0.6 percent on a seasonally adjusted basis from one week earlier. On an unadjusted basis, the Index increased 1 percent compared with the previous week. The Refinance Index increased 0.3 percent from the previous week and was 9 percent lower than the same week one year ago. The seasonally adjusted Purchase Index increased 1 percent from one week earlier. The unadjusted Purchase Index increased 1 percent compared with the previous week and was 19 percent lower than the same week one year ago.
“While most mortgage rates increased last week, rates on ARMs declined, leading to an increase in ARM volume and an increase in overall applications. The level of ARM applications increased by 15 percent over the week, bringing the ARM share up to 9.2 percent of all applications, the highest share since November 2022. The yield curve has become less inverted in recent weeks and ARM pricing has certainly improved,” said Joel Kan, MBA’s Vice President and Deputy Chief Economist. “The 30-year fixed mortgage rate is at 7.67 percent – the highest level since 2000 and 40 basis points higher than a month ago. Application activity remains depressed and close to multi-decade lows, with purchase applications still almost 20 percent behind last year’s pace. Refinance applications also continue to be limited, and the average loan size has fallen to its lowest level since 2017.”
...
The average contract interest rate for 30-year fixed-rate mortgages with conforming loan balances ($726,200 or less) increased to 7.67 percent from 7.53 percent, with points decreasing to 0.75 from 0.80 (including the origination fee) for 80 percent loan-to-value ratio (LTV) loans.
emphasis added
 Click on graph for larger image.
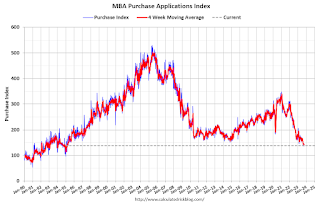
The first graph shows the MBA mortgage purchase index.
According to the MBA, purchase activity is down 19% year-over-year unadjusted.
Red is a four-week average (blue is weekly). The 4-week average is at the lowest level since 1995.

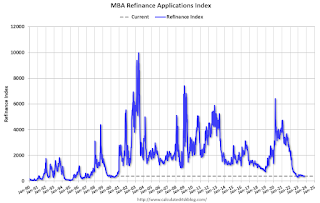
The second graph shows the refinance index since 1990.
With higher mortgage rates, the refinance index declined sharply in 2022 - and has mostly flat lined at a low level since then.