The first graph is the one Fed Chair Powell had mentioned earlier when services less rent of shelter was up 7.6% year-over-year. This has fallen sharply and is now up 2.8% YoY.
 Click on graph for larger image.
This graph shows the YoY price change for Services and Services less rent of shelter through September 2023.
Services were up 5.2% YoY as of September 2023, down from 5.4% YoY in August.
Services less rent of shelter was up 2.8% YoY in August, down from 3.1% YoY in August.
Services less rent of shelter was up 2.8% YoY in August, down from 3.1% YoY in August.
Earlier this year, a key question was: Would services ex-shelter inflation be persistent, or would it follow a similar pattern as goods? This is a topic I discussed in Pandemic Economics, Housing and Monetary Policy: Part 2.
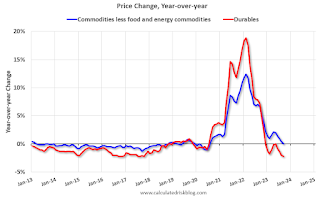
 The second graph shows that goods prices started to increase year-over-year (YoY) in 2020 and accelerated in 2021 due to both strong demand and supply chain disruptions.
 The second graph shows that goods prices started to increase year-over-year (YoY) in 2020 and accelerated in 2021 due to both strong demand and supply chain disruptions.
Durables were at -2.2% YoY as of September 2023, down from -2.0% YoY in August.
Commodities less food and energy commodities were unchanged YoY in September, down from 0.4% YoY in August.
Commodities less food and energy commodities were unchanged YoY in September, down from 0.4% YoY in August.
Goods inflation was transitory.
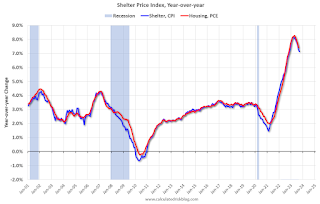
 Here is a graph of the year-over-year change in shelter from the CPI report (through August) and housing from the PCE report (through July 2023)
Shelter was up 7.1% year-over-year in September, down from 7.2% in August. Housing (PCE) was up 7.4% YoY in August, down from 7.7% in July.
The BLS noted this morning: "The index for shelter was the largest contributor to the monthly all items increase, accounting for over half of the increase."
Core CPI ex-shelter was up 1.9% YoY in September, down from 2.3% in August.