by Calculated Risk on 12/31/2023 08:23:00 AM
Sunday, December 31, 2023
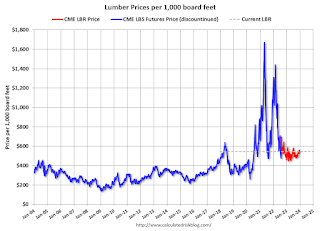
Update: Lumber Prices Up 9.6% YoY
This graph shows CME random length framing futures through last August (blue), and the new physically-delivered Lumber Futures (LBR) contract starting in August 2022 (Red).
Saturday, December 30, 2023
Real Estate Newsletter Articles this Week: Case-Shiller: National House Price Index Up 4.8% year-over-year
by Calculated Risk on 12/30/2023 02:11:00 PM
At the Calculated Risk Real Estate Newsletter this week:
• Case-Shiller: National House Price Index Up 4.8% year-over-year in October
• FHFA’s National Mortgage Database: Outstanding Mortgage Rates, LTV and Credit Scores
• Inflation Adjusted House Prices 2.4% Below Peak
• Question #10 for 2024: Will inventory increase further in 2024?
• Fannie and Freddie Serious Delinquencies in November: Single Family Mostly Unchanged, Multi-Family Increased
• Freddie Mac House Price Index Increased in November; Up 6.3% Year-over-year
This is usually published 4 to 6 times a week and provides more in-depth analysis of the housing market.
You can subscribe at https://calculatedrisk.substack.com/
Schedule for Week of December 31, 2023
by Calculated Risk on 12/30/2023 08:11:00 AM
Happy New Year! Wishing you all the best in 2024.
The key report this week is the December employment report on Friday.
Other key indicators include the December ISM manufacturing, December vehicle sales and November Job Openings.
The NYSE and the NASDAQ will be closed in observance of the New Year’s Day holiday
10:00 AM: Construction Spending for November. The consensus is for a 0.5% increase in construction spending.
7:00 AM ET: The Mortgage Bankers Association (MBA) will release the results for the mortgage purchase applications index.
 10:00 AM ET: Job Openings and Labor Turnover Survey for November from the BLS.
 This graph shows job openings (black line), hires (dark blue), Layoff, Discharges and other (red column), and Quits (light blue column) from the JOLTS.
Jobs openings decreased in October to 8.73 million from 9.35 million in September
10:00 AM: ISM Manufacturing Index for December. The consensus is for the ISM to be at 47.1, up from 46.7 in November.
2:00 PM: FOMC Minutes, Meeting of December 12-13, 2023
 Late: Light vehicle sales for December.
The Wards forecast is for 15.7 million SAAR in December, up from the BEA estimate of 15.32 million SAAR in November (Seasonally Adjusted Annual Rate).
This graph shows light vehicle sales since the BEA started keeping data in 1967. The dashed line is the current sales rate.
8:15 AM: The ADP Employment Report for December. This report is for private payrolls only (no government). The consensus is for 130,000, up from 103,000 jobs added in November.
8:30 AM: The initial weekly unemployment claims report will be released.
 8:30 AM: Employment Report for December. The consensus is for 158,000 jobs added, and for the unemployment rate to increase to 3.8%.
There were 199,000 jobs added in November, and the unemployment rate was at 3.7%.
This graph shows the jobs added per month since January 2021.
10:00 AM: the ISM Services Index for December.
Friday, December 29, 2023
Dec 29th COVID Update: Hospitalizations Increased
by Calculated Risk on 12/29/2023 07:33:00 PM

| COVID Metrics | ||||
|---|---|---|---|---|
| Now | Week Ago | Goal | ||
| Hospitalized2🚩 | 21,597 | 20,050 | ≤3,0001 | |
| Deaths per Week2 | 1,464 | 1,545 | ≤3501 | |
| 1my goals to stop weekly posts, 2Weekly for Currently Hospitalized, and Deaths 🚩 Increasing number weekly for Hospitalized and Deaths ✅ Goal met. | ||||
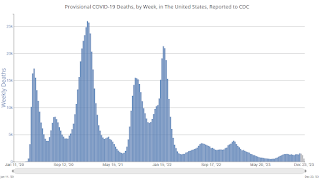 Click on graph for larger image.
This graph shows the weekly (columns) number of deaths reported.
And here is a new graph I'm following on COVID in wastewater as of Dec 28th:
 This appears to be a leading indicator for COVID hospitalizations and deaths.
Philly Fed: State Coincident Indexes Increased in 25 States in November (3-Month Basis)
by Calculated Risk on 12/29/2023 02:24:00 PM
From the Philly Fed:
The Federal Reserve Bank of Philadelphia has released the coincident indexes for the 50 states for November 2023. Over the past three months, the indexes increased in 25 states, decreased in 21 states, and remained stable in four, for a three-month diffusion index of 8. Additionally, in the past month, the indexes increased in 18 states, decreased in 21 states, and remained stable in 11, for a one-month diffusion index of -6. For comparison purposes, the Philadelphia Fed has also developed a similar coincident index for the entire United States. The Philadelphia Fed’s U.S. index increased 0.7 percent over the past three months and 0.3 percent in November.Note: These are coincident indexes constructed from state employment data. An explanation from the Philly Fed:
emphasis added
The coincident indexes combine four state-level indicators to summarize current economic conditions in a single statistic. The four state-level variables in each coincident index are nonfarm payroll employment, average hours worked in manufacturing by production workers, the unemployment rate, and wage and salary disbursements deflated by the consumer price index (U.S. city average). The trend for each state’s index is set to the trend of its gross domestic product (GDP), so long-term growth in the state’s index matches long-term growth in its GDP.
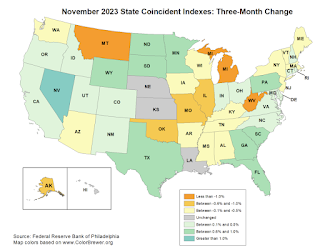 Click on map for larger image.
Here is a map of the three-month change in the Philly Fed state coincident indicators. This map was all red during the worst of the Pandemic and also at the worst of the Great Recession.
The map is split between positive and negative on a three-month basis.
Source: Philly Fed.
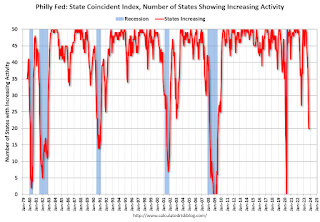 And here is a graph is of the number of states with one month increasing activity according to the Philly Fed.
 In November, 20 states had increasing activity on a single month basis, including minor increases.
Freddie Mac House Price Index Increased in November; Up 6.3% Year-over-year
by Calculated Risk on 12/29/2023 11:11:00 AM
Today, in the Calculated Risk Real Estate Newsletter: Freddie Mac House Price Index Increased in November; Up 6.3% Year-over-year
A brief excerpt:
On a year-over-year basis, the National FMHPI was up 6.3% in November, from up 5.6% YoY in October. The YoY increase peaked at 19.1% in July 2021, and for this cycle, bottomed at up 0.9% YoY in April 2023. ...There is much more in the article. You can subscribe at https://calculatedrisk.substack.com/
As of November, 9 states and D.C. were below their previous peaks, Seasonally Adjusted. The largest seasonally adjusted declines from the recent peak were in Idaho (-4.2%), Utah (-2.0%), Louisiana (-1.7%), and Colorado (-1.4%).
For cities (Core-based Statistical Areas, CBSA), here are the 30 cities with the largest declines from the peak, seasonally adjusted. Austin continues to be the worst performing city.
...
I’ll have an update on the House Price Battle Royale: Low Inventory vs Affordability soon.
Question #10 for 2024: Will inventory increase further in 2024?
by Calculated Risk on 12/29/2023 08:35:00 AM
Today, in the Real Estate Newsletter: Question #10 for 2024: Will inventory increase further in 2024?
Brief excerpt:
Earlier I posted some questions on my blog for next year: Ten Economic Questions for 2024. Some of these questions concern real estate (inventory, house prices, housing starts, new home sales), and I’ll post thoughts on those in the newsletter (others like GDP and employment will be on my blog).There is much more in the article. You can subscribe at https://calculatedrisk.substack.com/
I'm adding some thoughts, and maybe some predictions for each question.
10) Housing Inventory: Housing inventory decreased sharply during the pandemic to record lows in early 2022. Since then, inventory has increased, but is still well below pre-pandemic levels. Will inventory increase further in 2024?
...
First, a brief history. Here are a few times when watching existing home inventory helped my analysis.
Starting in January 2005, I was very bearish on housing, but I wasn’t sure when the market would turn. Speculative bubbles can go on and on. However, the increase in inventory in late 2005 (see red arrow on graph) helped me call the top for house prices in 2006.Several years later, in early 2012, when many people were still bearish on housing, the plunge in inventory in 2011 (blue arrow on graph below) helped me call the bottom for house prices in early 2012 (see The Housing Bottom is Here).
...
Somewhat lower mortgage rates - and time - will likely lead to more new listings in 2024. Still, mortgage rates will remain well above the pandemic lows, and therefore new listings will be depressed again in 2024.
The bottom line is inventory will probably increase year-over-year in 2024. However, it seems unlikely that inventory will be back up to the 2019 levels. Inventory is always something to watch!
Thursday, December 28, 2023
Friday: Chicago PMI
by Calculated Risk on 12/28/2023 08:22:00 PM
Friday:
• At 9:45 AM: Chicago Purchasing Managers Index for December.
Hotels: Occupancy Rate Increased 0.5% Year-over-year
by Calculated Risk on 12/28/2023 03:11:00 PM
As anticipated ahead of the holidays, U.S. hotel performance fell from the previous week, according to CoStar’s latest data through 23 December. ...The following graph shows the seasonal pattern for the hotel occupancy rate using the four-week average.
17-23 December 2023 (percentage change from comparable week in 2022):
• Occupancy: 43.9% (+0.5%)
• Average daily rate (ADR): US$131.97 (-0.9%)
• Revenue per available room (RevPAR): US$57.90 (-0.4%)
emphasis added
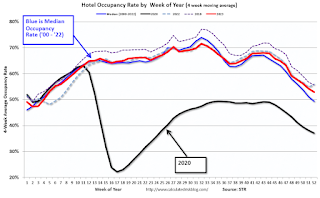 Click on graph for larger image.
The red line is for 2023, black is 2020, blue is the median, and dashed light blue is for 2022. Dashed purple is for 2018, the record year for hotel occupancy.
Las Vegas November 2023: Visitor Traffic Up 1% YoY; Convention Traffic Up 3%
by Calculated Risk on 12/28/2023 01:54:00 PM
From the Las Vegas Visitor Authority: November 2023 Las Vegas Visitor Statistics
With highlights including the SEMA tradeshow in the first week of the month and of course, the inaugural Formula 1 Las Vegas Grand Prix on Nov 16‐18, Las Vegas tourism metrics exceeded last November across several categories, most notably with record ADR and RevPAR.
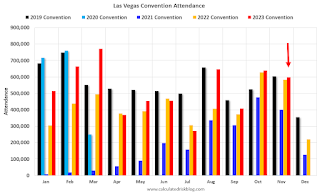
Visitor volume exceeded 3.29M, ahead of last November by +0.8%, and convention attendance approached 600k, +2.7% YoY.
Overall hotel occupancy was 81.9%, +0.7 pts YoY, as Weekend occupancy reached 88.7% (‐0.9 pts YoY) while Midweek occupancy exceeded last November by 1.4 pts to reach 78.9% for the month. Driven by strong rates during the dates of the F1 race, monthly ADR reached a record $249, +33.7% YoY and RevPAR exceeded $204, +34.8% YoY
 Click on graph for larger image.
 The first graph shows visitor traffic for 2019 (Black), 2020 (light blue), 2021 (purple), 2022 (orange), and 2023 (red).
Visitor traffic was up 0.8% compared to last November.
Update on FirstAm Cyber Attack
by Calculated Risk on 12/28/2023 01:42:00 PM
Update on FirstAm cyber attack (started on Dec 20th). This will impact December house closings. From FirstAm:
"FirstAm.com has been restored (with some limits to functionality). We will continue to post updates on this page as we return to normal business operations."
NAR: Pending Home Sales Unchanged in November; Down 5.2% Year-over-year
by Calculated Risk on 12/28/2023 10:00:00 AM
From the NAR: Pending Home Sales Recorded No Change in November
Pending home sales in November were identical to those in October, according to the National Association of REALTORS®. The Northeast, Midwest and West posted monthly gains in transactions while the South recorded a loss. All four U.S. regions registered year-over-year declines in transactions.This was below expectations. Note: Contract signings usually lead sales by about 45 to 60 days, so this would usually be for closed sales in December and January.
The Pending Home Sales Index (PHSI)* – a forward-looking indicator of home sales based on contract signings – stayed at 71.6 in November. Year over year, pending transactions were down 5.2%. An index of 100 is equal to the level of contract activity in 2001.
...
The Northeast PHSI rose 0.8% from last month to 64.4, a drop of 6.4% from November 2022. The Midwest index increased 0.5% to 76.2 in November, down 2.2% from one year ago.
The South PHSI declined 2.3% to 83.2 in November, decreasing 6.5% from the prior year. The West index climbed 4.2% in November to 54.0, falling 4.9% from November 2022.
emphasis added
Weekly Initial Unemployment Claims Increase to 218,000
by Calculated Risk on 12/28/2023 08:30:00 AM
The DOL reported:
In the week ending December 23, the advance figure for seasonally adjusted initial claims was 218,000, an increase of 12,000 from the previous week's revised level. The previous week's level was revised up by 1,000 from 205,000 to 206,000. The 4-week moving average was 212,000, a decrease of 250 from the previous week's revised average. The previous week's average was revised up by 250 from 212,000 to 212,250.The following graph shows the 4-week moving average of weekly claims since 1971.
emphasis added
 Click on graph for larger image.
The dashed line on the graph is the current 4-week average. The four-week average of weekly unemployment claims decreased to 212,000.
The previous week was revised up.
Weekly claims were above the consensus forecast.
Wednesday, December 27, 2023
Thursday: Unemployment Claims, Pending Home Sales
by Calculated Risk on 12/27/2023 06:46:00 PM
Thursday:
• At 8:30 AM ET, The initial weekly unemployment claims report will be released. The consensus is for 210 thousand, up from 205 thousand last week.
• At 10:00 AM, Pending Home Sales Index for November. The consensus is for a 0.9% increase in the index.
Inflation Adjusted House Prices 2.4% Below Peak; Price-to-rent index is 6.7% below recent peak
by Calculated Risk on 12/27/2023 11:55:00 AM
Today, in the Calculated Risk Real Estate Newsletter: Inflation Adjusted House Prices 2.4% Below Peak; Price-to-rent index is 6.7% below recent peak
Excerpt:
It has been over 17 years since the bubble peak. In the October Case-Shiller house price index released yesterday, the seasonally adjusted National Index (SA), was reported as being 70% above the bubble peak in 2006. However, in real terms, the National index (SA) is about 10% above the bubble peak (and historically there has been an upward slope to real house prices). The composite 20, in real terms, is 1% above the bubble peak.
People usually graph nominal house prices, but it is also important to look at prices in real terms. As an example, if a house price was $300,000 in January 2010, the price would be $424,000 today adjusted for inflation (41% increase). That is why the second graph below is important - this shows "real" prices.
The third graph shows the price-to-rent ratio, and the fourth graph is the affordability index. The last graph shows the 5-year real return based on the Case-Shiller National Index.
...
The second graph shows the same two indexes in real terms (adjusted for inflation using CPI).
In real terms (using CPI), the National index is 2.4% below the recent peak, and the Composite 20 index is 3.3% below the recent peak in 2022.
In real terms, national house prices are 10.3% above the bubble peak levels. There is an upward slope to real house prices, and it has been about 17 years since the previous peak, but real prices are historically high.
Fannie and Freddie Serious Delinquencies in November: Single Family Mostly Unchanged, Multi-Family Increased
by Calculated Risk on 12/27/2023 08:19:00 AM
Today, in the Calculated Risk Real Estate Newsletter: Fannie and Freddie Serious Delinquencies in November: Single Family Mostly Unchanged, Multi-Family Increased
Brief excerpt:
Single-family serious delinquencies were mostly unchanged in November, however, multi-family serious delinquencies increased.You can subscribe at https://calculatedrisk.substack.com/.
...
Freddie Mac reports that multi-family delinquencies increased to 0.28% in November, up from 0.15% in November 2022.
This graph shows the Freddie multi-family serious delinquency rate since 2012. Rates were still high in 2012 following the housing bust and financial crisis.
The multi-family rate increased following the pandemic and has increased recently as rent growth has slowed, vacancy rates have increased, and interest rates have increased sharply. This will be something to watch as rents soften, and more apartments come on the market.
Tuesday, December 26, 2023
Wednesday: Richmond Fed Mfg
by Calculated Risk on 12/26/2023 07:30:00 PM

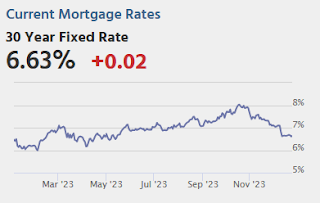
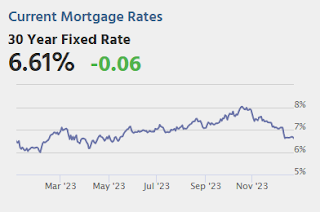
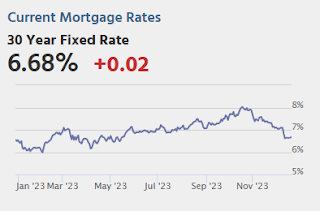
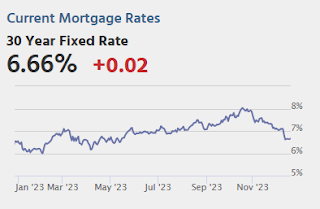
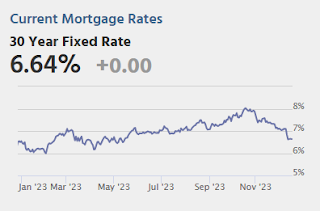
After dropping precipitously from over 8% in late October to well under 7% by December 14th, mortgage rates have been stone silent. In the 7 business days that have followed, the average top tier 30yr fixed rate hasn't moved enough to impact the typical mortgage quote. Our index has drifted microscopically higher and lower, never moving more than 0.02% from one day to the next, and never more than 0.03% from the center of the range. [30 year fixed 6.67%]Wednesday:
emphasis added
• At 10:00 AM ET, Richmond Fed Survey of Manufacturing Activity for December. This is the last of regional manufacturing surveys for December.
NOTE: No MBA mortgage survey this week.
A few comments on the Seasonal Pattern for House Prices
by Calculated Risk on 12/26/2023 01:24:00 PM
Two key points:
1) There is a clear seasonal pattern for house prices.
2) The surge in distressed sales during the housing bust distorted the seasonal pattern. This was because distressed sales (at lower price points) happened at a steady rate all year, while regular sales followed the normal seasonal pattern. This made for larger swings in the seasonal factor during the housing bust.
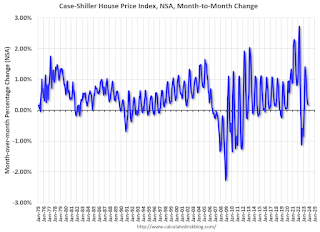
This graph shows the month-to-month change in the NSA Case-Shiller National index since 1987 (through October 2023). The seasonal pattern was smaller back in the '90s and early '00s and increased once the bubble burst.
The seasonal swings declined following the bust, however the more recent price surge changed the month-over-month pattern.

The swings in the seasonal factors were decreasing following the bust but have increased again recently - this time without a surge in distressed sales.
Comments on October Case-Shiller and FHFA House Prices
by Calculated Risk on 12/26/2023 09:45:00 AM
Today, in the Calculated Risk Real Estate Newsletter: Case-Shiller: National House Price Index Up 4.8% year-over-year in October
Excerpt:
S&P/Case-Shiller released the monthly Home Price Indices for October ("October" is a 3-month average of August, September and October closing prices). October closing prices include some contracts signed in June, so there is a significant lag to this data. Here is a graph of the month-over-month (MoM) change in the Case-Shiller National Index Seasonally Adjusted (SA).
The MoM increase in the seasonally adjusted Case-Shiller National Index was at 0.65%. This was the ninth consecutive MoM increase following seven straight MoM decreases.
On a seasonally adjusted basis, prices increased in 19 of the 20 Case-Shiller cities on a month-to-month basis. Prices declined slightly in Portland in October. Seasonally adjusted, San Francisco has fallen 8.1% from the recent peak, Seattle is down 6.5% from the peak, Portland down 4.3%, Las Vegas is down 4.2%, and Phoenix is down 3.9%.
Case-Shiller: National House Price Index Up 4.8% year-over-year in October
by Calculated Risk on 12/26/2023 09:00:00 AM
S&P/Case-Shiller released the monthly Home Price Indices for October ("October" is a 3-month average of August, September and October closing prices).
This release includes prices for 20 individual cities, two composite indices (for 10 cities and 20 cities) and the monthly National index.
From S&P S&P CoreLogic Case-Shiller Index Accelerates in October
The S&P CoreLogic Case-Shiller U.S. National Home Price NSA Index, covering all nine U.S. census divisions, reported a 4.8% annual change in October, up from a 4% change in the previous month. The 10-City Composite showed an increase of 5.7%, up from a 4.8% increase in the previous month. The 20-City Composite posted a year-over-year increase of 4.9%, up from a 3.9% increase in the previous month. Detroit reported the highest year-over-year gain among the 20 cities with an 8.1% increase in October, followed again by San Diego with a 7.2% increase. Portland fell 0.6% and remained the only city reporting lower prices in October versus a year ago.
...
Before seasonal adjustment, the U.S. National Index and 10-City Composite, posted 0.2% month-over-month increases in October, while the 20-City composite posted 0.1% increase.
After seasonal adjustment, the U.S. National Index, the 10-City and 20-City Composites each posted month-over-month increases of 0.6%.
"U.S. home prices accelerated at their fastest annual rate of the year in October”, says Brian D. Luke, Head of Commodities, Real & Digital assets at S&P DJI. Our National Composite rose by 0.2% in October, marking nine consecutive monthly gains and the strongest national growth rate since 2022.”
“Detroit kept pace as the fastest growing market for the second month in a row, registering an 8.1% annual gain. San Diego maintained the second spot with 7.2% annual gains, following by New York with a 7.1% gain. We are experiencing broad based home price appreciation across the country, with steady gains seen in nineteen of twenty cities. This month’s report reflects trendline growth compared to historical returns and little disparity among cities and regions.”
“Each of our 10-city, 20-city and National Index, remain at all-time highs, with 8 of 20 cities registering all-time highs (Miami, Atlanta, Chicago, Boston, Detroit, Charlotte, New York and Cleveland). While Portland remains slightly down compared to last year’s gains, Phoenix and Las Vegas have flipped to year over year gains. The Midwest and the Northeast region are fastest growing markets, while the Southwest and West regions have lagged other regions for over a year. A solid, if unspectacular report, this month’s index reflects a rising tide across nearly all markets.
 Click on graph for larger image.
 The first graph shows the nominal seasonally adjusted Composite 10, Composite 20 and National indices (the Composite 20 was started in January 2000).
The Composite 10 index is up 0.6% in October (SA) and is at a new all-time high.
The Composite 20 index is up 0.6% (SA) in October and is also at a new all-time high.
The National index is up 0.6% (SA) in October and is also at a new all-time high.
 The second graph shows the year-over-year change in all three indices.
The Composite 10 SA is up 5.7% year-over-year. The Composite 20 SA is up 4.9% year-over-year.
The National index SA is up 4.8% year-over-year.
Annual price changes were close to expectations. I'll have more later.
FHFA’s National Mortgage Database: Outstanding Mortgage Rates, LTV and Credit Scores
by Calculated Risk on 12/26/2023 08:00:00 AM
Today, in the Calculated Risk Real Estate Newsletter: FHFA’s National Mortgage Database: Outstanding Mortgage Rates, LTV and Credit Scores
A brief excerpt:
Here are some graphs on outstanding mortgages by interest rate, the average mortgage interest rate, borrowers’ credit scores and current loan-to-value (LTV) from the FHFA’s National Mortgage Database through Q3 2023 (released last Friday).There is much more in the article. You can subscribe at https://calculatedrisk.substack.com/
...
Here is some data showing the distribution of interest rates on closed-end, fixed-rate 1-4 family mortgages outstanding at the end of each quarter since Q1 2013 through Q3 2023.
This shows the surge in the percent of loans under 3%, and also under 4%, starting in early 2020 as mortgage rates declined sharply during the pandemic. The percent of outstanding loans under 4% peaked in Q1 2022 at 65.4% (now at 59.4%), and the percent under 5% peaked at 85.7% (now at 78.7%). These low existing mortgage rates makes it difficult for homeowners to sell their homes and buy a new home since their monthly payments would increase sharply. This is a key reason existing home inventory levels are so low.
The percent of loans over 6% bottomed in Q2 2022 at 7.1% and has increased to 11.5% in Q3 2023.
Monday, December 25, 2023
Tuesday: Case-Shiller House Prices
by Calculated Risk on 12/25/2023 07:34:00 PM
Weekend:
• Ten Economic Questions for 2024
• Schedule for Week of December 24, 2023
Tuesday:
• At 8:30 AM ET, Chicago Fed National Activity Index for November. This is a composite index of other data.
• At 9:00 AM, FHFA House Price Index for October. This was originally a GSE only repeat sales, however there is also an expanded index.
• Also at 9:00 AM, S&P/Case-Shiller House Price Index for October. The consensus is for an 5.0% year-over-year increase in the National index for October.
• At 10:30 AM, Dallas Fed Survey of Manufacturing Activity for December.
From CNBC: Pre-Market Data and Bloomberg futures S&P 500 are up 6 and DOW futures are up 67 (fair value).
Oil prices were up over the last week with WTI futures at $73.56 per barrel and Brent at $79.07 per barrel. A year ago, WTI was at $80, and Brent was at $82 - so WTI oil prices were down 8% year-over-year.
Here is a graph from Gasbuddy.com for nationwide gasoline prices. Nationally prices are at $3.09 per gallon. A year ago, prices were at $3.06 per gallon, so gasoline prices are up slightly year-over-year.
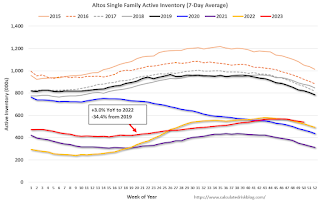
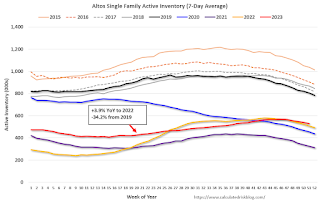
Housing December 25th Weekly Update: Inventory Down 1.9% Week-over-week, Up 3.9% Year-over-year
by Calculated Risk on 12/25/2023 10:48:00 AM
 Click on graph for larger image.
This inventory graph is courtesy of Altos Research.
Happy Holidays!
by Calculated Risk on 12/25/2023 09:21:00 AM
Happy Holidays and Merry Christmas to All!
Whose woods these are I think I know."Stopping by Woods on a Snowy Evening" by Robert Frost
His house is in the village though;
He will not see me stopping here
To watch his woods fill up with snow.
My little horse must think it queer
To stop without a farmhouse near
Between the woods and frozen lake
The darkest evening of the year.
He gives his harness bells a shake
To ask if there is some mistake.
The only other sound’s the sweep
Of easy wind and downy flake.
The woods are lovely, dark and deep,
But I have promises to keep,
And miles to go before I sleep,
And miles to go before I sleep.
Enjoy the season!
Sunday, December 24, 2023
Ten Economic Questions for 2024
by Calculated Risk on 12/24/2023 09:19:00 AM
Here is a review of the Ten Economic Questions for 2023
Below are my ten questions for 2024 (I've been doing this online every year for almost 20 years!). These are just questions; I'll follow up with some thoughts on each of these questions.
The purpose of these questions is to provide a framework of how the U.S. economy will likely perform in 2024, and if there are surprises - like in 2020 with the pandemic - to adjust my thinking.
2) Employment: Through November 2023, the economy added 2.6 million jobs in 2023. This is down from 4.8 million jobs added in 2022, and 7.3 million in 2021 (the two best years ever), but still a solid year for employment gains. How much will job growth slow in 2024? Or will the economy lose jobs?
3) Unemployment Rate: The unemployment rate was at 3.7% in November, up from 3.6% in November 2022. Currently the FOMC is forecasting the unemployment rate will increase to the 4.0% to 4.2% range in Q4 2024. What will the unemployment rate be in December 2024?
4) Participation Rate: In November 2023, the overall participation rate was at 62.8%, up year-over-year from 62.2% in November 2022, but still below the pre-pandemic level of 63.3%. Long term, the BLS is projecting the overall participation rate will decline to 60.4% by 2032 due to demographics. What will the participation rate be in December 2024?
5) Inflation: Core PCE was up 3.2% YoY through November. This was down from a peak of 5.6% in early 2022. The FOMC is forecasting the YoY change in core PCE will be in the 2.4% to 2.7% range in Q4 2024. Will the core inflation rate decrease further in 2024, and what will the YoY core inflation rate be in December 2024?
6) Monetary Policy: To slow inflation, the FOMC raised the federal funds rate four times in 2023 from "4-1/4 to 4-1/2 percent" at the beginning of 2023, to "5-1/4 to 5-1/2" at the end of the year. Most FOMC participants expect around three 25 bp rate cuts in 2024. What will the Fed Funds rate be in December 2024?
7) Wage Growth: Wage growth was solid in 2023, up 4.0% year-over-year as of November, but down from 4.8% YoY in 2022. How much will wages increase in 2024?
8) Residential Investment: Residential investment (RI) was slightly negative through the first three quarters of 2023 as the housing market appeared to bottom. Through November, starts were down 9.9% year-to-date compared to the same period in 2021. New home sales were up 3.9% year-to-date through November. Note: RI is mostly investment in new single-family structures, multifamily structures, home improvement and commissions on existing home sales. How much will RI change in 2024? How about housing starts and new home sales in 2024?
9) House Prices: It appears house prices - as measured by the national repeat sales index (Case-Shiller, FHFA, and Freddie Mac) - will be up mid-single digits in 2023. What will happen with house prices in 2024?
10) Housing Inventory: Housing inventory decreased sharply during the pandemic to record lows in early 2022. Since then, inventory has increased, but is still well below pre-pandemic levels. Will inventory increase further in 2024?
• Question #1 for 2024: How much will the economy grow in 2024? Will there be a recession in 2024?
• Question #2 for 2024: How much will job growth slow in 2024? Or will the economy lose jobs?
• Question #3 for 2024: What will the unemployment rate be in December 2024?
• Question #4 for 2024: What will the participation rate be in December 2024?
• Question #5 for 2024: What will the YoY core inflation rate be in December 2024?
• Question #6 for 2024: What will the Fed Funds rate be in December 2024?
• Question #7 for 2024: How much will wages increase in 2024?
• Question #8 for 2024: How much will Residential investment change in 2024? How about housing starts and new home sales in 2024?
• Question #9 for 2024: What will happen with house prices in 2024?
• Question #10 for 2024: Will inventory increase further in 2024?
Saturday, December 23, 2023
Real Estate Newsletter Articles this Week: New Home Sales decrease to 590,000 Annual Rate in November
by Calculated Risk on 12/23/2023 02:11:00 PM
At the Calculated Risk Real Estate Newsletter this week:
• New Home Sales decrease to 590,000 Annual Rate in November
• NAR: Existing-Home Sales Increased to 3.82 million SAAR in November
• Single Family Starts Increase Sharply in November, Near Record Number of Multi-Family Housing Units Under Construction
• Final Look at Local Housing Markets in November
• Early Read on Existing Home Sales in November
• 4th Look at Local Housing Markets in November
This is usually published 4 to 6 times a week and provides more in-depth analysis of the housing market.
You can subscribe at https://calculatedrisk.substack.com/
Schedule for Week of December 24, 2023
by Calculated Risk on 12/23/2023 08:11:00 AM
Happy Holidays and Merry Christmas!
The key indicator this week is Case-Shiller House Prices for October.
All US markets will be closed in observance of the Christmas Holiday.
8:30 AM: Chicago Fed National Activity Index for November. This is a composite index of other data.
9:00 AM: FHFA House Price Index for October. This was originally a GSE only repeat sales, however there is also an expanded index.
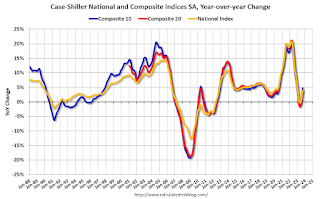 9:00 AM ET: S&P/Case-Shiller House Price Index for October.
This graph shows graph shows the Year over year change in the seasonally adjusted National Index, Composite 10 and Composite 20 indexes through the most recent report (the Composite 20 was started in January 2000).
The consensus is for an 5.0% year-over-year increase in the National index for October.
10:30 AM: Dallas Fed Survey of Manufacturing Activity for December.
10:00 AM: Richmond Fed Survey of Manufacturing Activity for December. This is the last of regional manufacturing surveys for December.
8:30 AM: The initial weekly unemployment claims report will be released. The consensus is for 210 thousand, up from 205 thousand last week.
10:00 AM: Pending Home Sales Index for November. The consensus is for a 0.9% increase in the index.
9:45 AM: Chicago Purchasing Managers Index for December.
Friday, December 22, 2023
Dec 22nd COVID Update: Hospitalizations Increased
by Calculated Risk on 12/22/2023 07:41:00 PM
| COVID Metrics | ||||
|---|---|---|---|---|
| Now | Week Ago | Goal | ||
| Hospitalized2🚩 | 19,686 | 18,708 | ≤3,0001 | |
| Deaths per Week2🚩 | 1,467 | 1,295 | ≤3501 | |
| 1my goals to stop weekly posts, 2Weekly for Currently Hospitalized, and Deaths 🚩 Increasing number weekly for Hospitalized and Deaths ✅ Goal met. | ||||
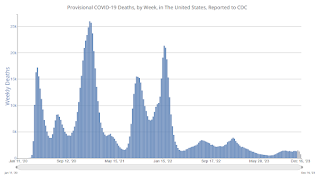 Click on graph for larger image.
This graph shows the weekly (columns) number of deaths reported.
AIA: "Architecture firm billings continue to decline in November"; Multi-family Billings Decline for 16th Consecutive Month
by Calculated Risk on 12/22/2023 03:20:00 PM
Note: This index is a leading indicator primarily for new Commercial Real Estate (CRE) investment.
From the AIA: ABI November 2023: Business conditions remain soft at architecture firms
Business conditions remained soft at architecture firms in November, as the AIA/Deltek Architecture Billings Index (ABI) remained below 50 with a score of 45.3 for the month (any score below 50 indicates declining billings). The score increased by one point from October, indicating that slightly fewer firms reported a decline in billings in November, but the majority of firms continued to report weak business for the fourth consecutive month, and the seventh month so far this year. However, there are still some encouraging signs of potential work in the pipeline as inquiries bounced back in November after declining in October. And while the value of new signed design contracts continued to decrease in November, fewer firms reported a decline than in October.• Regional averages: Northeast (44.4); South (46.7); Midwest (49.0); West (39.5)
Billings also remained weak at firms around the country in November, with firms in all regions reporting a decline for the fourth consecutive month. Business conditions remained softest at firms located in the West, which has been the case since March. And firms of all specializations also reported declining billings this month, with conditions remaining weakest at firms with a multifamily residential specialization. Billings also continued to decline further at firms with an institutional specialization, which was the strongest sector earlier this year.
emphasis added
• Sector index breakdown: commercial/industrial (45.7); institutional (46.6); multifamily residential (42.1)
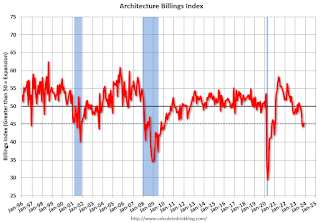 Click on graph for larger image.
This graph shows the Architecture Billings Index since 1996. The index was at 45.3 in November, up from 44.3 in October. Anything below 50 indicates a decrease in demand for architects' services.
Note: This includes commercial and industrial facilities like hotels and office buildings, multi-family residential, as well as schools, hospitals and other institutions.
This index usually leads CRE investment by 9 to 12 months, so this index suggests a slowdown in CRE investment in 2024.
Final Look at Local Housing Markets in November
by Calculated Risk on 12/22/2023 01:43:00 PM
Today, in the Calculated Risk Real Estate Newsletter: Final Look at Local Housing Markets in November
A brief excerpt:
I’ve added a comparison of active listings, new listings, and closings to the same month in 2019 (for markets with available data). This gives us a sense of the current low level of sales and inventory, and also shows some significant regional differences.There is much more in the article. You can subscribe at https://calculatedrisk.substack.com/
The big stories for November were that existing home sales were just above the cycle low on a seasonally adjusted annual rate basis (SAAR), and new listings were up YoY for the 2nd consecutive month!
This table shows the YoY change in new listings since early 2023 for the sample I track. The YoY increase in November was due to a combination of new listings collapsing in the 2nd half of 2022, and new listings holding up more than normal seasonally this year (but still historically very low).
This is the slow season for new listings, but it is likely new listings will be up solidly YoY in 2024.
...
More local data coming in January for activity in December!
New Home Sales decrease to 590,000 Annual Rate in November; Average New Home Price is Down 14% from the Peak
by Calculated Risk on 12/22/2023 10:53:00 AM
Today, in the Calculated Risk Real Estate Newsletter: New Home Sales decrease to 590,000 Annual Rate in November
Brief excerpt:
The Census Bureau reports New Home Sales in November were at a seasonally adjusted annual rate (SAAR) of 590 thousand. The previous three months were revised down.You can subscribe at https://calculatedrisk.substack.com/.
...
The next graph shows new home sales for 2022 and 2023 by month (Seasonally Adjusted Annual Rate). Sales in November 2023 were up 1.4% from November 2022. Year-to-date sales are up 3.9% compared to the same period in 2022.
Although sales disappointed in November, there will be more sales in 2023 than in 2022.
New Home Sales decrease to 590,000 Annual Rate in November
by Calculated Risk on 12/22/2023 10:00:00 AM
The Census Bureau reports New Home Sales in November were at a seasonally adjusted annual rate (SAAR) of 590 thousand.
The previous three months were revised down.
Sales of new single‐family houses in November 2023 were at a seasonally adjusted annual rate of 590,000, according to estimates released jointly today by the U.S. Census Bureau and the Department of Housing and Urban Development. This is 12.2 percent below the revised October rate of 672,000, but is 1.4 percent above the November 2022 estimate of 582,000.
emphasis added
 Click on graph for larger image.
The first graph shows New Home Sales vs. recessions since 1963. The dashed line is the current sales rate.
New home sales were slightly below pre-pandemic levels.
The second graph shows New Home Months of Supply.
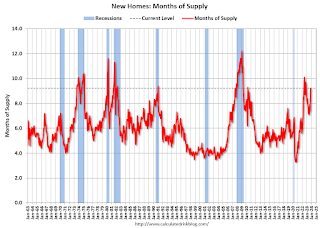 The months of supply increased in November to 9.2 months from 7.9 months in October.
 The all-time record high was 12.2 months of supply in January 2009. The all-time record low was 3.3 months in August 2020.
This is well above the top of the normal range (about 4 to 6 months of supply is normal).
"The seasonally‐adjusted estimate of new houses for sale at the end of November was 451,000. This represents a supply of 9.2 months at the current sales rate."Sales were well below expectations of 695 thousand SAAR, and sales for the three previous months were revised down. I'll have more later today.
PCE Measure of Shelter Slows to 6.7% YoY in November
by Calculated Risk on 12/22/2023 08:52:00 AM
Here is a graph of the year-over-year change in shelter from the CPI report and housing from the PCE report this morning, both through November 2023.
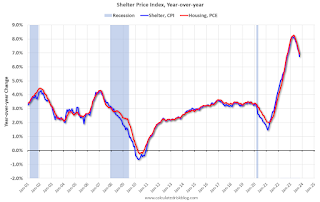
Since asking rents are mostly flat year-over-year, these measures will continue to slow over coming months.
Over the last 6 months (annualized):
PCE Price Index: 2.0%
Core PCE Prices: 1.9%
Core minus Housing: 1.1%
Personal Income increased 0.4% in November; Spending increased 0.2%
by Calculated Risk on 12/22/2023 08:30:00 AM
The BEA released the Personal Income and Outlays report for November:
Personal income increased $81.6 billion (0.4 percent at a monthly rate) in November, according to estimates released today by the Bureau of Economic Analysis. Disposable personal income (DPI), personal income less personal current taxes, increased $71.9 billion (0.4 percent) and personal consumption expenditures (PCE) increased $46.7 billion (0.2 percent).The November PCE price index increased 2.6 percent year-over-year (YoY), down from 2.9 percent YoY in October, and down from the recent peak of 7.1 percent in June 2022.
The PCE price index decreased 0.1 percent. Excluding food and energy, the PCE price index increased 0.1 percent. Real DPI increased 0.4 percent in November and real PCE increased 0.3 percent; goods increased 0.5 percent and services increased 0.2 percent.
emphasis added
The following graph shows real Personal Consumption Expenditures (PCE) through November 2023 (2012 dollars). Note that the y-axis doesn't start at zero to better show the change.
 Click on graph for larger image.
The dashed red lines are the quarterly levels for real PCE.
Personal income was at expectations, and PCE was slightly below expectations.
Using the two-month method to estimate Q4 real PCE growth, real PCE was increasing at a 2.3% annual rate in Q4 2023. (Using the mid-month method, real PCE was increasing at 3.1%). This suggests solid PCE growth in Q4.
Thursday, December 21, 2023
Friday: Personal Income and Outlays, Durable Goods, New Home Sales
by Calculated Risk on 12/21/2023 07:35:00 PM
Friday:
• At 8:30 AM ET, Durable Goods Orders for November. The consensus is for a 0.1% increase..
• Also at 8:30 AM, Personal Income and Outlays for November. The consensus is for a 0.4% increase in personal income, and for a 0.3% increase in personal spending. And for no change in the PCE price index, and the Core PCE price index to increase 0.2%. PCE prices are expected to be up 2.8% YoY, and core PCE prices up 3.4% YoY.
• At 10:00 AM, New Home Sales for November from the Census Bureau. The consensus is for 695 thousand SAAR, up from 679 thousand in October.
• Also at 10:00 AM, University of Michigan's Consumer sentiment index (Final for December).
• Also at 10:00 AM, State Employment and Unemployment (Monthly) for November 2023
December Vehicle Sales Forecast: 15.7 million SAAR, Up 16% YoY
by Calculated Risk on 12/21/2023 04:00:00 PM
From WardsAuto: December U.S. Light-Vehicle Sales Tracking to End Year on Positive Note (pay content). Brief excerpt:
Higher inventory and increased discounting, combined with a rebound in fleet deliveries, will lead December's results. With Q4 totaling a 15.5 million-unit annualized rate, sales in entire-2023 will total a 4-year-high 15.4 million units. Inventory will enter 2024 31% higher than a year ago.
emphasis added
 Click on graph for larger image.
This graph shows actual sales from the BEA (Blue), and Wards forecast for December (Red).
On a seasonally adjusted annual rate basis, the Wards forecast of 15.7 million SAAR, would be up 2.5% from last month, and up 16% from a year ago.
Hotels: Occupancy Rate Increased 1.1% Year-over-year
by Calculated Risk on 12/21/2023 02:10:00 PM
U.S. hotel performance was expectedly lower from the previous week, but year-over-year comparisons were positive, according to CoStar’s latest data through 16 December. ...The following graph shows the seasonal pattern for the hotel occupancy rate using the four-week average.
10-16 December 2023 (percentage change from comparable week in 2022):
• Occupancy: 54.7% (+1.1%)
• Average daily rate (ADR): US$142.62 (+4.7%)
• Revenue per available room (RevPAR): US$77.99 (+5.8%)
emphasis added
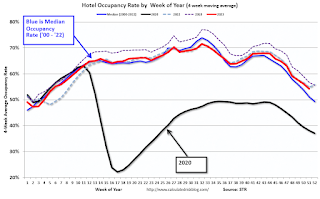 Click on graph for larger image.
The red line is for 2023, black is 2020, blue is the median, and dashed light blue is for 2022. Dashed purple is for 2018, the record year for hotel occupancy.
ICE: Mortgage Delinquency Rate Increased Slightly in November
by Calculated Risk on 12/21/2023 10:01:00 AM
From ICE (formerly Black Knight): ICE First Look at November Mortgage Performance: Delinquencies Historically Low Despite Seasonal Rise; Performance of Recent Originations Worth Watching
• The national delinquency rate edged higher to 3.39% in November – down 10 basis points (bps) from the same time last year – but remains 64 bps below pre-pandemic levels
• Likewise, early-stage delinquencies among VA loans hit their highest non-pandemic levels since 2009, as rising interest rates have begun to impact performance among recently originated loans
• Serious delinquencies (90+ days past due) rose to 459K, but remain down 123K (-21%) from November 2022
• Foreclosure starts decreased -12.2% in November to 29K with active foreclosure inventory falling to 216K, some 23% and 24% below 2019 levels respectively
• Prepayment activity fell again under continued pressure from seasonal homebuying patterns along with the residual effects of 30-year rates climbing above 7.75% the month prior
| Black Knight: Percent Loans Delinquent and in Foreclosure Process | ||||
|---|---|---|---|---|
| Nov 2023 | Oct 2023 | Nov 2022 | Nov 2019 | |
| Delinquent | 3.39% | 3.26% | 3.01% | 3.53% |
| In Foreclosure | 0.41% | 0.41% | 0.37% | 0.47% |
| Number of properties: | ||||
| Number of properties that are delinquent, but not in foreclosure: | 1,804,000 | 1,734,000 | 1,734,000 | 1,868,000 |
| Number of properties in foreclosure pre-sale inventory: | 216,000 | 217,000 | 196,000 | 248,000 |
| Total Properties | 2,020,000 | 1,951,000 | 1,808,000 | 2,116,000 |
Q3 GDP Growth Revised down to 4.9% Annual Rate
by Calculated Risk on 12/21/2023 08:38:00 AM
From the BEA: Gross Domestic Product (Third Estimate), Corporate Profits (Revised Estimate), and GDP by Industry, Third Quarter 2023
Real gross domestic product (GDP) increased at an annual rate of 4.9 percent in the third quarter of 2023, according to the "third" estimate released by the Bureau of Economic Analysis. In the second quarter, real GDP increased 2.1 percent.Here is a Comparison of Third and Second Estimates. PCE growth was revised down from 3.6% to 3.1%. Residential investment was revised up from 6.2% to 6.7%.
The GDP estimate released today is based on more complete source data than were available for the "second" estimate issued last month. In the second estimate, the increase in real GDP was 5.2 percent. The update primarily reflected a downward revision to consumer spending. Imports, which are a subtraction in the calculation of GDP, were revised down (refer to "Updates to GDP").
The increase in real GDP reflected increases in consumer spending, private inventory investment, exports, state and local government spending, federal government spending, residential fixed investment, and nonresidential fixed investment. Imports increased.
emphasis added
Weekly Initial Unemployment Claims Increase to 205,000
by Calculated Risk on 12/21/2023 08:30:00 AM
The DOL reported:
In the week ending December 16, the advance figure for seasonally adjusted initial claims was 205,000, an increase of 2,000 from the previous week's revised level. The previous week's level was revised up by 1,000 from 202,000 to 203,000. The 4-week moving average was 212,000, a decrease of 1,500 from the previous week's revised average. The previous week's average was revised up by 250 from 213,250 to 213,500.The following graph shows the 4-week moving average of weekly claims since 1971.
emphasis added
 Click on graph for larger image.
The dashed line on the graph is the current 4-week average. The four-week average of weekly unemployment claims decreased to 212,000.
The previous week was revised up.
Weekly claims were well below the consensus forecast.
Wednesday, December 20, 2023
Thursday: GDP, Unemployment Claims, Philly Fed Mfg
by Calculated Risk on 12/20/2023 07:52:00 PM
Thursday:
• At 8:30 AM ET, The initial weekly unemployment claims report will be released. The consensus is for 218 thousand, up from 202 thousand last week.
• At 8:30 AM, Gross Domestic Product, 3rd quarter 2023 (Third estimate). The consensus is for real GDP at 5.2% annualized, unchanged from the second estimate of 5.2%.
• At 8:30 AM, the Philly Fed manufacturing survey for December. The consensus is for a reading of -3.0, up from -5.9.
• At 11:00 AM, the Kansas City Fed manufacturing survey for December.
Review: Ten Economic Questions for 2023
by Calculated Risk on 12/20/2023 02:05:00 PM
At the end of each year, I post Ten Economic Questions for the following year (2023). I followed up with a brief post on each question. Here is review (we don't have all data yet, but enough). I've linked to my posts from the beginning of the year, with a brief excerpt and a few comments.
I don't have a crystal ball, but I think it helps to outline what I think will happen - and understand - and change my mind, when the outlook is wrong. As an example, when the pandemic hit, I switched from being mostly positive on the economy to calling a recession in early March 2020.
10) Question #10 for 2023: Will inventory increase further in 2023?
"The bottom line is inventory will probably increase year-over-year in 2023."
Here is a graph from Altos Research showing active single-family inventory through December 15, 2023.
The red line is for 2023. The black line is for 2019. Note that inventory is up from the record low for the same week in 2021, but still well below normal levels.
9) Question #9 for 2023: What will happen with house prices in 2023?
"[M]ost homeowners have substantial equity, and a low fixed-rate mortgage, and they can afford the monthly payments. So, it is extremely unlikely that we see a surge in distressed sales like happened after the housing bubble. And that means prices probably won’t decline sharply like in 2008 when prices fell about 12% according to the Case-Shiller National Index.
So, based on my inventory and mortgage rate forecasts, my guess is that year-over-year house prices will decrease in 2023, probably in the low-to-mid single digit range. "
 I was correct about prices not falling sharply, but house prices actually increased in 2023. That is why I changed my mind!
As of September, the National Case-Shiller index SA was up 3.9% year-over-year. (Case-Shiller for October will be released next week).
It appears prices will still be up mid-single digits in December.
8) Question #8 for 2023: How much will Residential investment change in 2023? How about housing starts and new home sales in 2023?
"[M]y guess is that new home sales will bottom for this cycle in 2023, down another 15% to 20% from 2022 levels.
My guess is multi-family starts will decline in 2023 as rents soften and as the record number of housing units under construction are completed. Total starts will likely be down around 15% to 20% year-over-year in 2023, depending on how quickly multifamily starts slow down."
 I was expecting further weakness for new home sales early in the year, and new home sales actually bottomed in July 2022.
This graph shows new home sales for 2022 and 2023 by month (Seasonally Adjusted Annual Rate). Sales in October 2023 were up 17.7% from October 2022. Year-to-date sales are up 4.6% compared to the same period in 2022.
The low level of existing home inventory, combined with mortgage rate buydowns, helped new home sales increase in 2023.
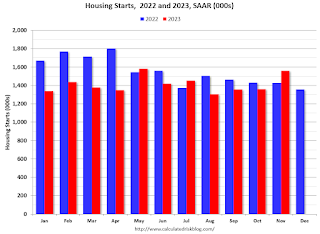 The next graph shows housing starts for 2022 and 2023 by month (Seasonally Adjusted Annual Rate).
Total starts year-to-date are down 9.9% compared to last year.
This was a somewhat smaller decline for total starts than I expected.
7) Question #7 for 2023: How much will wages increase in 2023?
"My sense is nominal wages will increase in the 3.0% to 3.5% YoY range in 2023 according to the CES."
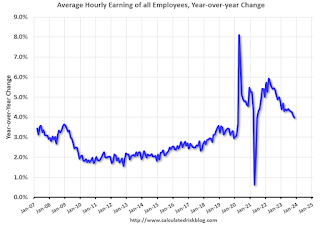 The graph shows the nominal year-over-year change in "Average Hourly Earnings" for all private employees from the Current Employment Statistics (CES).
 Wage growth has trended down after peaking at 5.9% YoY in March 2022 and was at 4.0% YoY in November.
6) Question #6 for 2023: What will the Fed Funds rate be in December 2023?
"My guess is there will be around 2 rate hikes in 2023, and if there are more, the FOMC will be under pressure later in 2023 to cut rates putting the Fed Funds rate under 5% at the end of 2023."There were 4 rate hikes in 2023 with the Fed Funds rate target range at 5-1/4 to 5-1/2 percent in December 2023. The Fed is now expected to cut rates in 2024.
5) Question #5 for 2023: What will the YoY core inflation rate be in December 2023?
"My guess is core PCE inflation (year-over-year) will decrease in 2023 (from the current 4.7%), and I think core PCE inflation will be below 3% by the end of 2023."According to the October Personal Income and Outlays report, the October PCE price index increased 3.0 percent year-over-year and the October PCE price index, excluding food and energy, increased 3.5 percent year-over-year. And PCE measures of inflation are expected to slow further in November and December.
4) Question #4 for 2023: What will the participation rate be in December 2023?
"There are probably a few more people that will return to the workforce in 2023, pushing up the participation rate. However, demographics will be pushing the rate down. So, my guess is the participation rate will be mostly unchanged year-over-year, around 62.3%."My guess was somewhat low since more people entered the labor force than I expected (also impacting job growth). The Labor Force Participation Rate was at 62.8% in November.
3) Question #3 for 2023: What will the unemployment rate be in December 2023?
"[M]y guess is the unemployment rate will increase to around 4% in December 2023 from the current 3.5%. (Lower than the FOMC forecast of 4.4% to 4.7%)."The unemployment rates was at 3.7% in November (this guess was looking good in October when the unemployment rate hit 3.9%).
2) Question #2 for 2023: How much will job growth slow in 2023? Or will the economy lose jobs?
"My sense is the FOMC is overly pessimistic, and my guess is there will be something like 400 to 800 thousand jobs added in 2023."
 This graph shows the jobs added per month since January 2021.
Through November the economy has added 2.55 million jobs, well above my guess. At least I was much closer than the Fed!
1) Question #1 for 2023: How much will the economy grow in 2023? Will there be a recession in 2023?
"My sense is growth will stay sluggish in 2023, but the economy will avoid recession. ... My guess is that real GDP growth will probably be positive in the 1.0% range in 2023.I was correct about no recession, but growth will likely be closer to 2.7% or so in 2023.
I was more optimistic than most analysts (no recession, positive job growth, inflation falling), but not optimistic enough!

