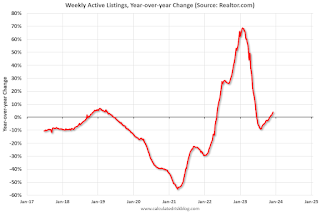
• Active inventory increased, with for-sale homes 4.0% above year ago levels.
Active listings in the past week grew by 4.0% above the previous year, the 5th straight week of annual growth. However, active listings are still declining seasonally, with listings down 1.1% compared with the previous week and down 4.2% compared to the late seasonal peak in November. For the remainder of the season until March, we expect that inventory will experience a typical seasonal decline ...
• New listings–a measure of sellers putting homes up for sale–were up this week, by 6.8% from one year ago.
After an extended period of less listing activity from sellers due to the mortgage rate lock-in effect, newly listed homes have risen above last year’s levels for the 7th week in a row. ... However, the pace of new listings is still expected to be below typical pre-pandemic levels. In this past week, they were still 20.6% below similar weeks in 2017 to 2019.
 Here is a graph of the year-over-year change in inventory according to realtor.com.
 Inventory was up year-over-year for the 5th consecutive week following 20 consecutive weeks with a YoY decrease in inventory.
Inventory is still historically very low.
New listings really collapsed a year ago, so the YoY comparison for new listings is easier now - although new listings remain well below "typical pre-pandemic levels", new listings are now up YoY for the 7th consecutive week.