by Calculated Risk on 1/12/2024 08:11:00 AM
Friday, January 12, 2024
AAR: December Carloads and Intermodal Up YoY
From the Association of American Railroads (AAR) Rail Time Indicators. Graphs and excerpts reprinted with permission.
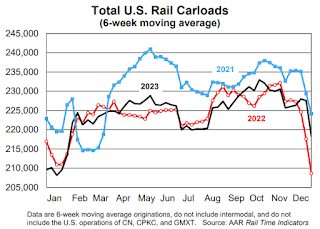
U.S. railroads originated 11.70 million total carloads in 2023 — up 0.7% (81,504 carloads) over 2022, up 0.7% (78,633 carloads) over 2021, and the most for a full year since 2019.
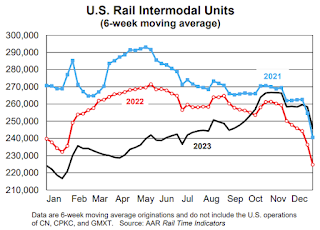
For all of 2023, U.S. intermodal originations totaled 12.67 million containers and trailers — down 4.9% (657,165 units) from 2022, down 9.6% (1.35 million) from 2021, and the lowest annual volume since 2013. In 2023, containers were 94.9% of U.S. intermodal units, a record high.
2023 is only the second year in our records (1996 was the other) in which total carloads were up over the previous year but intermodal was down.
emphasis added
 Click on graph for larger image.
This graph from the Rail Time Indicators report shows the six-week average of U.S. Carloads in 2021, 2022 and 2023:
Total carloads in December 2023 were up 7.3% over December 2022, the biggest year-over-year monthly percentage gain since February 2022. Total carloads were up 2.0% in Q4 2023 over Q4 2022, their best year-over-year quarterly percentage gain since Q1 2022.
 The second graph shows the six-week average (not monthly) of U.S. intermodal in 2021, 2022 and 2023: (using intermodal or shipping containers):
In December 2023, U.S. intermodal volume was up 10.2% over December 2022, intermodal’s biggest monthly year-over-year percentage gain since June 2021. Intermodal was up 5.5% in Q4 2023 over Q4 2022, its biggest quarterly gain since Q2 2021.


