by Calculated Risk on 2/02/2024 07:02:00 PM
Friday, February 02, 2024
Feb 2nd COVID Update: Weekly Deaths Increased

Due to changes at the CDC, weekly cases are no longer updated.
For deaths, I'm currently using 4 weeks ago for "now", since the most recent three weeks will be revised significantly.
Hospitalizations have more than quadrupled from a low of 5,150 in June 2023.
Hospitalizations are now declining.
| COVID Metrics | ||||
|---|---|---|---|---|
| Now | Week Ago | Goal | ||
| Hospitalized2 | 21,659 | 25,041 | ≤3,0001 | |
| Deaths per Week2🚩 | 2,258 | 2,076 | ≤3501 | |
| 1my goals to stop weekly posts, 2Weekly for Currently Hospitalized, and Deaths 🚩 Increasing number weekly for Hospitalized and Deaths ✅ Goal met. | ||||
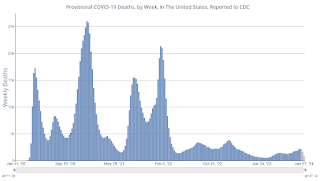
 Click on graph for larger image.
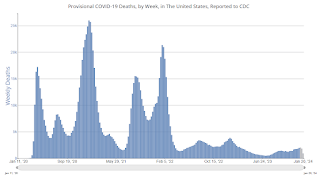
This graph shows the weekly (columns) number of deaths reported.
Weekly deaths have more than quadrupled from a low of 485 in early July. Still weekly deaths are far below the weekly peak of 26,000 in January 2021.
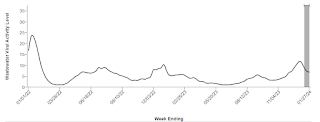
 This appears to be a leading indicator for COVID hospitalizations and deaths.
Nationally, COVID in wastewater is now off about 40% of the holiday peak at the end of December, and that suggests weekly deaths will start to decrease soon. The South region is at a new peak for COVID in wastewater.


