U.S. rail traffic recovered in February after severe weather constrained volumes in January.
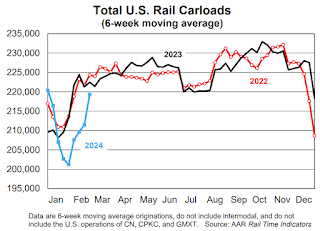
Total originated carloads on U.S. railroads averaged 221,387 per week in February, up from 205,034 in January. Total carloads were down 1.3% in February 2024 from February 2023. That’s a big improvement from January’s 7.2% decline.
...
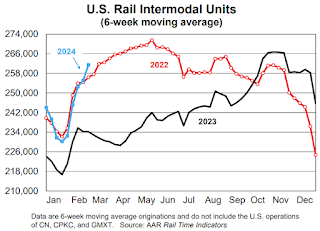
Meanwhile, U.S. intermodal originations in February 2024 were up 10.9% over February 2023. That’s their biggest percentage gain in 32 months and the sixth straight gain of any size. Intermodal averaged 260,078 units per week in February 2024, the second most in 16 months.
emphasis added
 Click on graph for larger image.
This graph from the Rail Time Indicators report shows the six-week average of U.S. Carloads in 2022, 2023 and 2024:
In February, originated carloads on U.S. railroads were 885,548, down 1.3% (11,410 carloads) from last year. That’s a big improvement from January’s 7.2% decline. Carloads averaged 221,387 per week in February, up from 205,034 in January. Generally speaking, carload volumes remain constrained in part because the goods-side of the U.S. economy, including manufacturing as a whole (see pages 7 and 8), is not doing as well as it could be.
 The second graph shows the six-week average (not monthly) of U.S. intermodal in 2022, 2023 and 2024: (using intermodal or shipping containers):
U.S. intermodal originations in February 2024 totaled 1.04 million containers and trailers, up 10.9% (102,140 units) over February 2023. That’s the biggest year-over-year percentage gain for intermodal in 32 months and the sixth straight gain of any size. Intermodal averaged 260,078 units per week in February, up from 241,203 in January and the second most in 16 months.