Now - on a weekly basis - inventory is up 36.5% YoY.
Realtor.com has monthly and weekly data on the existing home market. Here is their weekly report: Weekly Housing Trends View—Data for Week Ending May 25, 2024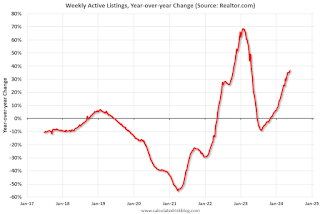 Here is a graph of the year-over-year change in inventory according to realtor.com.
Inventory was up year-over-year for the 29th consecutive week.
Realtor.com has monthly and weekly data on the existing home market. Here is their weekly report: Weekly Housing Trends View—Data for Week Ending May 25, 2024
• Active inventory increased, with for-sale homes 36.5% above year-ago levels.
For the 29th straight week, there were more homes listed for sale versus the prior year, giving homebuyers more options. This past week, the inventory of homes for sale grew by 36.5% compared with last year, and it was the highest since July 2020 in the early days of the COVID-19 Pandemic. This growth in inventory is primarily driven by housing markets in the South, which saw a 43.0% year-over-year increase in inventory in April.
• New listings–a measure of sellers putting homes up for sale–were up this week, by 3.6% from one year ago.
Seller activity continued to climb annually last week but decelerated relative to the previous week’s growth. Newly listed homes grew by 3.6% compared with a year ago, a slowdown from the 8.1% growth rate in the previous week.
 Here is a graph of the year-over-year change in inventory according to realtor.com.
 Inventory was up year-over-year for the 29th consecutive week.
However, inventory is still historically very low.
New listings remain below typical pre-pandemic levels although up year-over-year.