 RSS Feed
 by Calculated Risk on 6/01/2024 08:11:00 AM
Saturday, June 01, 2024
Schedule for Week of June 2, 2024
The key report scheduled for this week is the May employment report.
Other key reports include the May ISM Manufacturing, Vehicle Sales and April trade balance.
10:00 AM: ISM Manufacturing Index for May. The consensus is for the ISM to be at 49.7, up from 49.2 in April.
10:00 AM: Construction Spending for April. The consensus is for a 0.2% increase in construction spending.
 Late: Light vehicle sales for May.
The consensus is for light vehicle sales to be 15.9 million SAAR in May, up from 15.7 million in April (Seasonally Adjusted Annual Rate).
This graph shows light vehicle sales since the BEA started keeping data in 1967. The dashed line is the sales rate for last month.
----- Tuesday, June 4th -----
 10:00 AM ET: Job Openings and Labor Turnover Survey for April from the BLS.
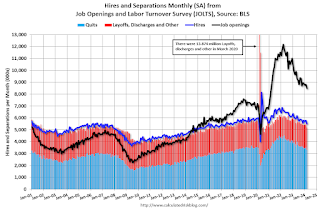
This graph shows job openings (black line), hires (purple), Layoff, Discharges and other (red column), and Quits (light blue column) from the JOLTS.
Jobs openings decreased in March to 8.49 million from 8.81 million in February. The number of job openings (black) were down 12% year-over-year.
----- Wednesday, June 5th -----
7:00 AM ET: The Mortgage Bankers Association (MBA) will release the results for the mortgage purchase applications index.
8:15 AM: The ADP Employment Report for May. This report is for private payrolls only (no government). The consensus is for 174,000 payroll jobs added in May, down from 192,000 in April.
10:00 AM: the ISM Services Index for May. The consensus is for a reading of 50.5, up from 59.4.
----- Thursday, June 6th -----
 8:30 AM: Trade Balance report for April from the Census Bureau.
This graph shows the U.S. trade deficit, with and without petroleum.
 10:00 AM ET: Job Openings and Labor Turnover Survey for April from the BLS.
 This graph shows job openings (black line), hires (purple), Layoff, Discharges and other (red column), and Quits (light blue column) from the JOLTS.
Jobs openings decreased in March to 8.49 million from 8.81 million in February. The number of job openings (black) were down 12% year-over-year.
7:00 AM ET: The Mortgage Bankers Association (MBA) will release the results for the mortgage purchase applications index.
8:15 AM: The ADP Employment Report for May. This report is for private payrolls only (no government). The consensus is for 174,000 payroll jobs added in May, down from 192,000 in April.
10:00 AM: the ISM Services Index for May. The consensus is for a reading of 50.5, up from 59.4.
 8:30 AM: Trade Balance report for April from the Census Bureau.
 This graph shows the U.S. trade deficit, with and without petroleum.
The blue line is the total deficit, and the black line is the petroleum surplus, and the red line is the trade deficit ex-petroleum products.
The consensus is the trade deficit to be $69.7 billion. The U.S. trade deficit was at $69.4 Billion in March.
8:30 AM: The initial weekly unemployment claims report will be released. The consensus is for 215 thousand initial claims, down from 219 thousand last week.
----- Friday, June 7th -----
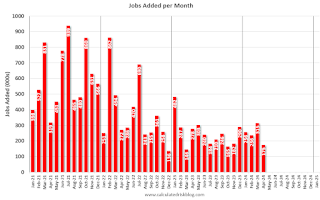 8:30 AM: Employment Report for May. The consensus is for 180,000 jobs added, and for the unemployment rate to be unchanged at 3.9%.
There were 175,000 jobs added in April, and the unemployment rate was at 3.9%.
This graph shows the jobs added per month since January 2021.
12:00 PM: Q1 Flow of Funds Accounts of the United States from the Federal Reserve.
The consensus is the trade deficit to be $69.7 billion. The U.S. trade deficit was at $69.4 Billion in March.
8:30 AM: The initial weekly unemployment claims report will be released. The consensus is for 215 thousand initial claims, down from 219 thousand last week.
 8:30 AM: Employment Report for May. The consensus is for 180,000 jobs added, and for the unemployment rate to be unchanged at 3.9%.
There were 175,000 jobs added in April, and the unemployment rate was at 3.9%.
This graph shows the jobs added per month since January 2021.
12:00 PM: Q1 Flow of Funds Accounts of the United States from the Federal Reserve.


