RSS Feed
 by Calculated Risk on 4/15/2025 02:38:00 PM
Tuesday, April 15, 2025
Las Vegas in February: Visitor Traffic Down 11.9% YoY; Convention Traffic Down 19.5% YoY
From the Las Vegas Visitor Authority: February 2025 Las Vegas Visitor Statistics
With the combined factors of a tough comparison to last year when Super Bowl LVIII was held in the destination, a net decrease in the convention segment tied to rotation cycles, and one fewer day on the calendar compared to the 2024 leap year, visitation fell below 3.0M for the month, down ‐11.9% YoY.
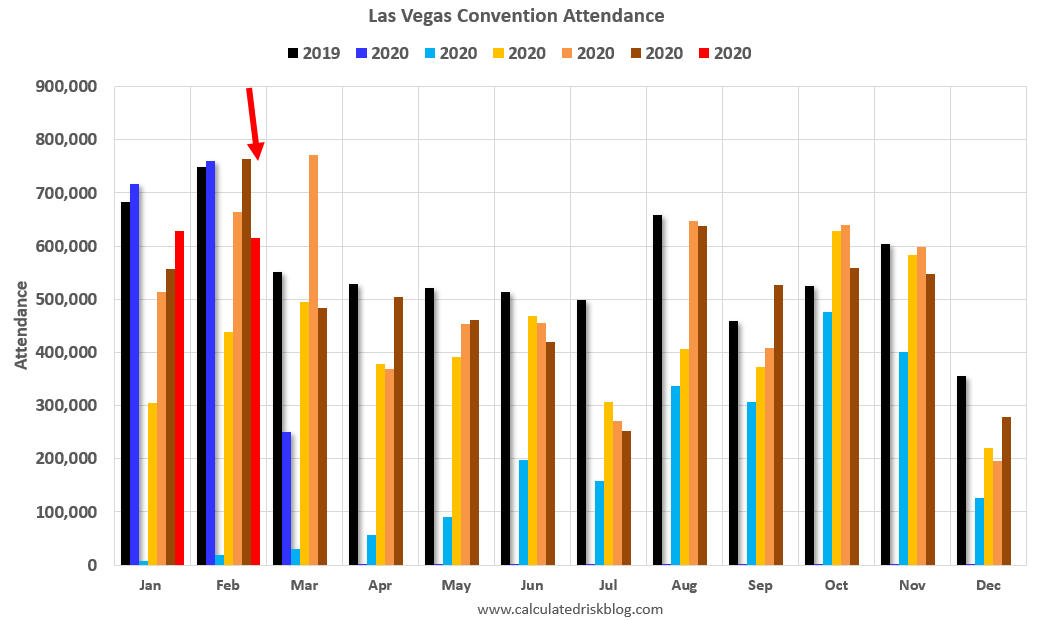
Las Vegas convention attendance reached roughly 615k in February, down ‐19.5% YoY, reflecting in part the calendar impact of World Market Center's Winter show (38k attendees) and Total Product Expo (8k attendees) ending in Jan this year vs. Feb last year, plus show rotations of Int'l Roofing Expo (15k attendees) and National Automobile Dealers Assn (22k attendees) which were held elsewhere this year.
Occupancy reached 80.5%, down ‐3.4 pts with Weekend occupancy of 86.4% (down ‐3.9 pts) and Midweek occupancy of 77.7% (down ‐3.3 pts.) ADR for the month reached $186 (‐25% YoY) with RevPAR of $150 (‐28% YoY).
emphasis added
 Click on graph for larger image.
 The first graph shows visitor traffic for 2019 (Black), 2020 (dark blue), 2021 (light blue), 2022 (light orange), 2023 (orange), 2024 (dark orange) and 2025 (red).
Visitor traffic was down 11.9% compared to last February. Visitor traffic was down 6.8% compared to February 2019.
The second graph shows convention traffic.