 RSS Feed
 by Calculated Risk on 3/01/2022 08:00:00 AM
Tuesday, March 01, 2022
CoreLogic: House Prices up 19.1% YoY in January; "Highest Level in at Least 45 Years"
Notes: This CoreLogic House Price Index report is for January. The recent Case-Shiller index release was for December. The CoreLogic HPI is a three-month weighted average and is not seasonally adjusted (NSA).
From CoreLogic: New Year, New Highs: CoreLogic Reports Home Price Appreciation Reaches 19.1% in January – Highest Level in at Least 45 Years
CoreLogic® ... today released the CoreLogic Home Price Index (HPI™) and HPI Forecast™ for January 2022.
Consumers looking to purchase a home have remained optimistic moving into the new year, with more expecting to buy over the next six months as rapid home price appreciation is forecasted to slow. Despite market and economic challenges such as low inventory, continued buyer competition and declining affordability, potential buyers are ready to move while mortgage rates remain relatively low.
"In December and January, for-sale inventory continued to be the lowest we have seen in a generation,” said Dr. Frank Nothaft, chief economist at CoreLogic. “Buyers have continued to bid prices up for the limited supply on the market. However, the rise in mortgage rates since January further eroded buyer affordability and is expected to slow price gains in coming months.”
...
Nationally, home prices increased 19.1% in January 2022, compared to January 2021. On a month-over-month basis, home prices increased by 1.4% compared to December 2021.
...
Home price gains are projected to slow to a 3.8% annual increase by January 2023.
emphasis added
Monday, February 28, 2022
Tuesday: ISM Mfg, Construction Spending, Vehicle Sales
by Calculated Risk on 2/28/2022 08:36:00 PM
From Matthew Graham at Mortgage News Daily: Mortgage Rates Drop Noticeably as Global Drama Unfolds
To be sure, the average conventional 30yr fixed rate is still much higher than it was 3 weeks ago, but it's now lower than any day in between. Pricing is very stratified, depending on the lender, but the average lender is an entire eighth of a percent lower than Friday. That's a big move in general, but it's an exceptionally big move in the context of recent volatility.Tuesday:
emphasis added
• At 8:00 AM ET, Corelogic House Price index for January.
• At 10:00 AM, ISM Manufacturing Index for January. The consensus is for the ISM to be at 58.0, up from 57.6 in January.
• Also, at 10:00 AM, Construction Spending for December. The consensus is for a 0.2% decrease in construction spending.
• All day: Light vehicle sales for February. The consensus is for light vehicle sales to be 14.4 million SAAR in February, down from 15.0 million in January (Seasonally Adjusted Annual Rate).
On COVID (focus on hospitalizations and deaths):
| COVID Metrics | ||||
|---|---|---|---|---|
| Now | Week Ago | Goal | ||
| Percent fully Vaccinated | 64.9% | --- | ≥70.0%1 | |
| Fully Vaccinated (millions) | 215.6 | --- | ≥2321 | |
| New Cases per Day3 | 62,556 | 99,986 | ≤5,0002 | |
| Hospitalized3 | 41,242 | 62,792 | ≤3,0002 | |
| Deaths per Day3 | 1,686 | 1,940 | ≤502 | |
| 1 Minimum to achieve "herd immunity" (estimated between 70% and 85%). 2my goals to stop daily posts, 37-day average for Cases, Currently Hospitalized, and Deaths 🚩 Increasing 7-day average week-over-week for Cases, Hospitalized, and Deaths ✅ Goal met. | ||||
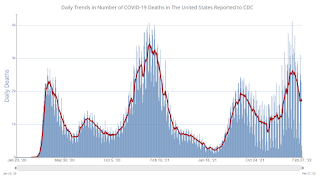 Click on graph for larger image.
This graph shows the daily (columns) and 7-day average (line) of deaths reported.
Fannie Mae: Mortgage Serious Delinquency Rate Decreased in January
by Calculated Risk on 2/28/2022 04:18:00 PM
Fannie Mae reported that the Single-Family Serious Delinquency decreased to 1.17% in January, from 1.25% in December. The serious delinquency rate is down from 2.80% in January 2021.
These are mortgage loans that are "three monthly payments or more past due or in foreclosure".
The Fannie Mae serious delinquency rate peaked in February 2010 at 5.59% following the housing bubble and peaked at 3.32% in August 2020 during the pandemic.

By vintage, for loans made in 2004 or earlier (1% of portfolio), 3.39% are seriously delinquent (down from 3.48% in December).
For loans made in 2005 through 2008 (2% of portfolio), 5.67% are seriously delinquent (down from 5.87%),
For recent loans, originated in 2009 through 2021 (97% of portfolio), 0.95% are seriously delinquent (down from 1.01%). So, Fannie is still working through a few poor performing loans from the bubble years.
Mortgages in forbearance are counted as delinquent in this monthly report, but they will not be reported to the credit bureaus.
The pandemic related increase in delinquencies was very different from the increase in delinquencies following the housing bubble. Lending standards had been fairly solid over the previous decade, and most of these homeowners had equity in their homes - and the vast majority of these homeowners have been able to restructure their loans once they were employed.
Freddie Mac reported earlier.
Median vs Repeat Sales Index House Prices
by Calculated Risk on 2/28/2022 12:37:00 PM
Today, in the Calculated Risk Real Estate Newsletter: Median vs Repeat Sales Index House Prices
Excerpt:
Back in October, I wrote The Coming Deceleration in House Price Growth. In that post, I noted that the median prices (as reported by the National Association of Realtors® (NAR) was showing a slowdown in year-over-year (YoY) house price growth.
In October ... the YoY growth in median prices started falling - and I expected Case-Shiller to follow.
Here is the same graph through the most recent reports.
Sure enough, the YoY growth in the Case-Shiller started to decelerate.
However, median prices have picked up over the last three months - so there isn’t evidence of a sharp decline in the YOY growth.
If there is a slowdown in house price growth, we should expect to see it in median prices first.

There is more in the article. You can subscribe at https://calculatedrisk.substack.com/
Housing Inventory February 28th Update: Inventory Down 1.3% Week-over-week; New Record Low
by Calculated Risk on 2/28/2022 10:12:00 AM
Tracking existing home inventory is very important in 2022.
Inventory usually declines in the winter, and this is a new record low for this series.

This inventory graph is courtesy of Altos Research.
As of February 25th, inventory was at 244 thousand (7-day average), compared to 325 thousand for the same week a year ago. That is a decline of 24.9%.
A week ago, inventory was at 248 thousand, and was down 25.8% YoY.
Inventory was down 1.3% from the previous week.
Compared to the same week in 2020, inventory is down 66.2% from 724 thousand.
Last year inventory bottomed seasonally in April 2021 - very late in the year - usually inventory bottoms by February. An early key in 2022 will be to watch if inventory bottoms earlier this year.
| Week Ending | YoY Change |
|---|---|
| 12/31/2021 | -30.0% |
| 1/7/2022 | -26.0% |
| 1/14/2022 | -28.6% |
| 1/21/2022 | -27.1% |
| 1/28/2022 | -25.9% |
| 2/4/2022 | -27.9% |
| 2/11/2022 | -27.5% |
| 2/18/2022 | -25.8% |
| 2/25/2022 | -24.9% |
Mike Simonsen discusses this data regularly on Youtube.
Six High Frequency Indicators for the Economy
by Calculated Risk on 2/28/2022 08:53:00 AM
These indicators are mostly for travel and entertainment. It is interesting to watch these sectors recover as the pandemic subsides.
There was a clear negative impact from the omicron variant of COVID that is starting to ease.
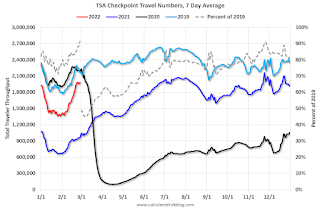
----- Airlines: Transportation Security Administration -----
The TSA is providing daily travel numbers.
This data is as of February 27th.
 Click on graph for larger image.
This data shows the 7-day average of daily total traveler throughput from the TSA for 2019 (Light Blue), 2020 (Black), 2021 (Blue) and 2022 (Red).
The dashed line is the percent of 2019 for the seven-day average.
The 7-day average is down 8.8% from the same day in 2019 (91.2% of 2019). (Dashed line) This is the smallest decline since the start of the pandemic.
----- Restaurants: OpenTable -----
The second graph shows the 7-day average of the year-over-year change in diners as tabulated by OpenTable for the US and several selected cities.
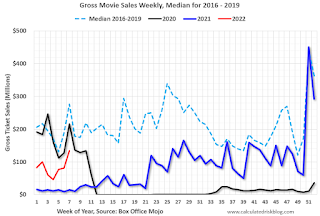
----- Movie Tickets: Box Office Mojo -----
 This data shows domestic box office for each week and the median for the years 2016 through 2019 (dashed light blue).
----- Hotel Occupancy: STR -----
 This graph shows the seasonal pattern for the hotel occupancy rate using the four-week average.
The red line is for 2022, black is 2020, blue is the median, and dashed light blue is for 2021.
This data is through February 19th. The occupancy rate was down 8.4% compared to the same week in 2019.
----- Transit: Apple Mobility -----
This graph is from Apple mobility. From Apple: "This data is generated by counting the number of requests made to Apple Maps for directions in select countries/regions, sub-regions, and cities." This is just a general guide - people that regularly commute probably don't ask for directions.
 This data is through February 24th
----- New York City Subway Usage -----
Here is some interesting data on New York subway usage (HT BR).
 This graph is from Todd W Schneider.
This data is through Friday, February 25th.
He notes: "Data updates weekly from the MTA’s public turnstile data, usually on Saturday mornings".
The TSA is providing daily travel numbers.
This data is as of February 27th.
Click on graph for larger image.This data shows the 7-day average of daily total traveler throughput from the TSA for 2019 (Light Blue), 2020 (Black), 2021 (Blue) and 2022 (Red).
The dashed line is the percent of 2019 for the seven-day average.
The 7-day average is down 8.8% from the same day in 2019 (91.2% of 2019). (Dashed line) This is the smallest decline since the start of the pandemic.
Air travel declined in early 2022 (omicron / weak business travel) but has picked up (both seasonally and less COVID).
The second graph shows the 7-day average of the year-over-year change in diners as tabulated by OpenTable for the US and several selected cities.
IMPORTANT: OpenTable notes that all data is compared to 2019. Thanks!
 Thanks to OpenTable for providing this restaurant data:
This data is updated through February 26, 2022.
This data is "a sample of restaurants on the OpenTable network across all channels: online reservations, phone reservations, and walk-ins. For year-over-year comparisons by day, we compare to the same day of the week from the same week in the previous year."
Dining was mostly moving sideways but declined during the winter wave of COVID and is now increasing. The 7-day average for the US is down 3% compared to 2019.
Thanks to OpenTable for providing this restaurant data:This data is updated through February 26, 2022.
This data is "a sample of restaurants on the OpenTable network across all channels: online reservations, phone reservations, and walk-ins. For year-over-year comparisons by day, we compare to the same day of the week from the same week in the previous year."
Dining was mostly moving sideways but declined during the winter wave of COVID and is now increasing. The 7-day average for the US is down 3% compared to 2019.
This data shows domestic box office for each week and the median for the years 2016 through 2019 (dashed light blue). Black is 2020, Blue is 2021 and Red is 2022.
The data is from BoxOfficeMojo through February 24th.
Note that the data is usually noisy week-to-week and depends on when blockbusters are released.
Movie ticket sales were at $134 million last week, down about 52% from the median for the week.
Note that the data is usually noisy week-to-week and depends on when blockbusters are released.
Movie ticket sales were at $134 million last week, down about 52% from the median for the week.
This graph shows the seasonal pattern for the hotel occupancy rate using the four-week average. The red line is for 2022, black is 2020, blue is the median, and dashed light blue is for 2021.
This data is through February 19th. The occupancy rate was down 8.4% compared to the same week in 2019.
The 4-week average of the occupancy rate is below the median rate for the previous 20 years (Blue).
Notes: Y-axis doesn't start at zero to better show the seasonal change.
Notes: Y-axis doesn't start at zero to better show the seasonal change.
The 4-week average of the occupancy rate will increase seasonally over the next few months.
This graph is from Apple mobility. From Apple: "This data is generated by counting the number of requests made to Apple Maps for directions in select countries/regions, sub-regions, and cities." This is just a general guide - people that regularly commute probably don't ask for directions.
This data is through February 24th for the United States and several selected cities.
The graph is the running 7-day average to remove the impact of weekends.
IMPORTANT: All data is relative to January 13, 2020. This data is NOT Seasonally Adjusted. People walk and drive more when the weather is nice, so I'm just using the transit data.
According to the Apple data directions requests, public transit in the 7-day average for the US is at 112% of the January 2020 level.
Here is some interesting data on New York subway usage (HT BR).
This graph is from Todd W Schneider. This graph shows how much MTA traffic has recovered in each borough (Graph starts at first week in January 2020 and 100 = 2019 average).
Manhattan is at about 32% of normal.
This data is through Friday, February 25th.
He notes: "Data updates weekly from the MTA’s public turnstile data, usually on Saturday mornings".
Sunday, February 27, 2022
Sunday Night Futures
by Calculated Risk on 2/27/2022 06:30:00 PM
Weekend:
• Schedule for Week of February 27, 2022
Monday:
• At 9:45 AM, Chicago Purchasing Managers Index for February. The consensus is for a reading of 63.9, down from 65.2 in January.
• At 10:30 AM, Dallas Fed Survey of Manufacturing Activity for February. This is the last of regional manufacturing surveys for February.
From CNBC: Pre-Market Data and Bloomberg futures S&P 500 futures are down 102, and and DOW futures are down 442 fair value).
Oil prices were up over the last week with WTI futures at $98.09 per barrel and Brent at $104.54 per barrel. A year ago, WTI was at $62, and Brent was at $66 - so WTI oil prices are up about 60% year-over-year.
Here is a graph from Gasbuddy.com for nationwide gasoline prices. Nationally prices are at $3.59 per gallon. A year ago prices were at $2.72 per gallon, so gasoline prices are up $0.87 per gallon year-over-year.
Las Vegas Visitor Authority for January 2022: Visitor Traffic Down 27.5% Compared to 2019
by Calculated Risk on 2/27/2022 01:24:00 PM
From the Las Vegas Visitor Authority: January 2022 Las Vegas Visitor Statistics
With the Omicron variant and continued impacts on the convention group segment, Las Vegas visitation reached 2.47M, roughly three‐quarters of pre‐COVID levels of January 2019 but dramatically higher (+91.2%) than January 2021.
Overall hotel occupancy reached 59.3%, +27.7 pts ahead of January 2021 but ‐24.7 pts below January 2019. Reflecting the challenged convention group segment, Midweek saw occupancy reach 52.0%, +29.5 pts vs. January 2021 but ‐30.1 pts vs. January 2019. As in the past several months, weekends fared better than midweek as Weekend occupancy reached 74.6%, +26.3 pts ahead of January 2021 and ‐14.2 pts vs. January 2019.
Reaching $145, January 2022 ADR exceeded January 2021 by +60.1% while lagging January 2019 by ‐7.2%. RevPAR reached $86.12 for the month, approx. triple January 2021's depressed levels but down ‐34.5% from January 2019.
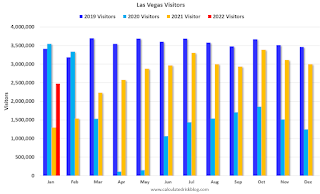 Click on graph for larger image.
 The first graph shows visitor traffic for 2019 (dark blue), 2020 (light blue), 2021 (yellow) and 2022 (red)
Visitor traffic was down 27.5% compared to the same month in 2019.
Traffic was up 91% compared to last January.
The second graph shows convention traffic.

Convention traffic was down 55.3% compared to January 2019.The second graph shows convention traffic.
Note: There was almost no convention traffic from April 2020 through May 2021.
Saturday, February 26, 2022
Real Estate Newsletter Articles this Week
by Calculated Risk on 2/26/2022 02:11:00 PM
At the Calculated Risk Real Estate Newsletter this week:
• January New Home Sales: Record 106 thousand Homes Have Not been Started New Home Sales decrease to 801,000 Annual Rate in January
• Real House Prices, Price-to-Rent Ratio and Price-to-Median Income in December And a look at "Affordability"
• Case-Shiller National Index up 18.8% Year-over-year in December FHFA: "House prices continued to climb but not as rapidly during the final quarter of 2021 as in earlier quarters"
• Final Look at Local Housing Markets in January Inventory at Record Low
This is usually published several times a week and provides more in-depth analysis of the housing market.
The blog will continue as always!
You can subscribe at https://calculatedrisk.substack.com/ Most content is available for free (and no Ads), but please subscribe!
You can subscribe at https://calculatedrisk.substack.com/ Most content is available for free (and no Ads), but please subscribe!
Schedule for Week of February 27, 2022
by Calculated Risk on 2/26/2022 08:11:00 AM
The key report scheduled for this week is the February employment report.
Other key reports scheduled for this week are ISM Manufacturing and February vehicle sales.
Fed Chair Powell presents the Semiannual Monetary Policy Report to the Congress on Wednesday and Thursday.
9:45 AM: Chicago Purchasing Managers Index for February. The consensus is for a reading of 63.9, down from 65.2 in January.
10:30 AM: Dallas Fed Survey of Manufacturing Activity for February. This is the last of regional manufacturing surveys for February.
8:00 AM: Corelogic House Price index for January.
10:00 AM: ISM Manufacturing Index for January. The consensus is for the ISM to be at 58.0, up from 57.6 in January.
10:00 AM: Construction Spending for December. The consensus is for a 0.2% decrease in construction spending.
 All day: Light vehicle sales for February. The consensus is for light vehicle sales to be 14.4 million SAAR in February, down from 15.0 million in January (Seasonally Adjusted Annual Rate).
This graph shows light vehicle sales since the BEA started keeping data in 1967. The dashed line is the January sales rate.
7:00 AM ET: The Mortgage Bankers Association (MBA) will release the results for the mortgage purchase applications index.
8:15 AM: The ADP Employment Report for February. This report is for private payrolls only (no government). The consensus is for 320,000 payroll jobs added in February, up from 301,000 lost in January.
10:00 AM: Testimony, Fed Chair Jerome Powell, Semiannual Monetary Policy Report to the Congress, Before the Committee on Financial Services, U.S. House of Representatives
2:00 PM: the Federal Reserve Beige Book, an informal review by the Federal Reserve Banks of current economic conditions in their Districts.
8:30 AM: The initial weekly unemployment claims report will be released. The consensus is for a decrease to 230 thousand from 232 thousand last week.
10:00 AM: Testimony, Fed Chair Jerome Powell, Semiannual Monetary Policy Report to the Congress, Before the Committee on Banking, Housing, and Urban Affairs, U.S. Senate
10:00 AM: the ISM Services Index for February.
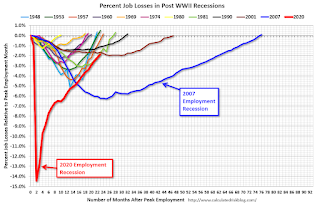 8:30 AM: Employment Report for February. The consensus is for 400,000 jobs added, and for the unemployment rate to decrease to 3.9%.
There were 467,000 jobs added in January, and the unemployment rate was at 4.0%.
This graph shows the job losses from the start of the employment recession, in percentage terms.
The current employment recession was by far the worst recession since WWII in percentage terms. However, the current employment recession, 23 months after the onset, is now significantly better than the worst of the "Great Recession".


