 RSS Feed
 by Calculated Risk on 12/03/2021 08:40:00 AM
Friday, December 03, 2021
November Employment Report: 210 thousand Jobs, 4.2% Unemployment Rate
From the BLS:
Total nonfarm payroll employment rose by 210,000 in November, and the unemployment rate fell by 0.4 percentage point to 4.2 percent, the U.S. Bureau of Labor Statistics reported today. Notable job gains occurred in professional and business services, transportation and warehousing, construction, and manufacturing. Employment in retail trade declined over the month.
...
The change in total nonfarm payroll employment for September was revised up by 67,000, from +312,000 to +379,000, and the change for October was revised up by 15,000, from +531,000 to +546,000. With these revisions, employment in September and October combined is 82,000 higher than previously reported.
emphasis added
 Click on graph for larger image.
The first graph shows the year-over-year change in total non-farm employment since 1968.
In November, the year-over-year change was 5.8 million jobs. This was up significantly year-over-year.
Total payrolls increased by 210 thousand in November. Private payrolls increased by 235 thousand, and public payrolls declined 25 thousand.
Payrolls for September and October were revised up 82 thousand, combined.
 The second graph shows the job losses from the start of the employment recession, in percentage terms.
The current employment recession was by far the worst recession since WWII in percentage terms. However, the current employment recession, 20 months after the onset, is now significantly better than the worst of the "Great Recession".
The third graph shows the employment population ratio and the participation rate.
 The Labor Force Participation Rate increased to 61.8% in November, from 61.6% in October. This is the percentage of the working age population in the labor force.
 The Employment-Population ratio increased to 59.2% from 58.8% (blue line).
I'll post the 25 to 54 age group employment-population ratio graph later.
 The fourth graph shows the unemployment rate.
 The unemployment rate decreased in November to 4.2% from 4.6% in October.
This was well below consensus expectations; however, August and September were revised up by 82,000 combined.
I'll have more later ...
Thursday, December 02, 2021
Friday: Employment Report
by Calculated Risk on 12/02/2021 09:01:00 PM
My November Employment Preview
Goldman November Payrolls Preview
Friday:
• At 8:30 AM ET, Employment Report for November. The consensus is for 563 thousand jobs added, and for the unemployment rate to decrease to 4.5%.
• At 10:00 AM, the ISM Services Index for November.
December 2nd COVID-19: Hospitalizations Increasing
by Calculated Risk on 12/02/2021 07:00:00 PM
The CDC is the source for all data.
According to the CDC, on Vaccinations. Total doses administered: 464,445,580.
| COVID Metrics | ||||
|---|---|---|---|---|
| Today | Week Ago | Goal | ||
| Percent fully Vaccinated | 59.6% | --- | ≥70.0%1 | |
| Fully Vaccinated (millions) | 197.8 | --- | ≥2321 | |
| New Cases per Day3 | 86,412 | 94,393 | ≤5,0002 | |
| Hospitalized3🚩 | 47,714 | 44,556 | ≤3,0002 | |
| Deaths per Day3 | 859 | 983 | ≤502 | |
| 1 Minimum to achieve "herd immunity" (estimated between 70% and 85%). 2my goals to stop daily posts, 37-day average for Cases, Currently Hospitalized, and Deaths 🚩 Increasing 7-day average week-over-week for Cases, Hospitalized, and Deaths ✅ Goal met. | ||||
IMPORTANT: For "herd immunity" most experts believe we need 70% to 85% of the total population fully vaccinated (or already had COVID). Note: COVID will probably stay endemic (at least for some time).
KUDOS to the residents of the 5 states that have achieved 70% of total population fully vaccinated: Vermont at 73.1%, Rhode Island, Connecticut, Maine, and Massachusetts at 71.4%.
KUDOS also to the residents of the 16 states and D.C. that have achieved 60% of total population fully vaccinated: New York at 68.7%, New Jersey, Maryland, Washington, Virginia, New Hampshire, Oregon, District of Columbia, New Mexico, Colorado, California, Minnesota, Pennsylvania, Illinois, Delaware, Florida, and Hawaii at 61.1%.
The following 19 states have between 50% and 59.9% fully vaccinated: Wisconsin at 59.7%, Nebraska, Iowa, Utah, Michigan, Texas, Kansas, Arizona, Nevada, South Dakota, North Carolina, Alaska, Ohio, Kentucky, Montana, Oklahoma, South Carolina, Missouri and Indiana at 50.7%.
Next up (total population, fully vaccinated according to CDC) are Georgia at 49.7%, Tennessee at 49.7%, Arkansas at 49.5%, Louisiana at 49.0% and North Dakota at 49.0%.
 Click on graph for larger image.
This graph shows the daily (columns) and 7-day average (line) of positive tests reported.
Goldman November Payrolls Preview
by Calculated Risk on 12/02/2021 04:09:00 PM
A few brief excerpts from a note by Goldman Sachs economist Spencer Hill:
We estimate nonfarm payrolls rose 575k in November ... Big Data employment indicators were mixed in the month, and we also see some chance that labor supply constraints weighed on pre-holiday hiring in the retail industry. ... We estimate a one-tenth drop in the unemployment rate to 4.5%, reflecting a strong household employment gain but a likely rebound in the labor force participation rateCR Note: The consensus is for 563 thousand jobs added, and for the unemployment rate to decrease to 4.5%.
emphasis added
Rents Still Increasing Sharply
by Calculated Risk on 12/02/2021 02:12:00 PM
Today, in the Real Estate Newsletter: Rents Still Increasing Sharply Rent increases slowing seasonally
Excerpt:
The Zillow measure is up 11.2% YoY in October, up from 10.3% YoY in September. And the ApartmentList measure is up 17.7% as of November, up from 16.9% in October. Both the Zillow measure (a repeat rent index), and ApartmentList are showing a sharp increase in rents.
...
Clearly rents are increasing sharply, and we should expect this to spill over into measures of inflation in 2022. The Owners’ Equivalent Rent (OER) was up 3.1% YoY in October, from 2.9% in September - and will increase further in the coming months.

November Employment Preview
by Calculated Risk on 12/02/2021 12:00:00 PM
On Friday at 8:30 AM ET, the BLS will release the employment report for November. The consensus is for 563 thousand jobs added, and for the unemployment rate to decrease to 4.5%.
 Click on graph for larger image.
• First, currently there are still about 4.2 million fewer jobs than in February 2020 (before the pandemic).
This graph shows the job losses from the start of the employment recession, in percentage terms.
The current employment recession was by far the worst recession since WWII in percentage terms. However, the current employment recession, 20 months after the onset, is now significantly better than the worst of the "Great Recession".
• ADP Report: The ADP employment report showed a gain of 534,000 private sector jobs, close to the consensus estimate of 525,000 jobs added. The ADP report hasn't been very useful in predicting the BLS report, but this suggests the BLS report could be close to expectations.
• ISM Surveys: Note that the ISM services are diffusion indexes based on the number of firms hiring (not the number of hires). The ISM® manufacturing employment index increased in November to 53.3%, up from 52.0% last month. This would suggest no change in manufacturing employment in November. ADP showed 50,000 manufacturing jobs added.
The ISM® Services employment index will be released tomorrow.
• Unemployment Claims: The weekly claims report showed a decline in the number of initial unemployment claims during the reference week (includes the 12th of the month) from 291,000 in October to 270,000 in November. This would usually suggest fewer layoffs in October than in September, although this might not be very useful right now. In general, weekly claims have been falling, and have been below expectations in November.
 • Permanent Job Losers: Something to watch in the employment report will be "Permanent job losers". This graph shows permanent job losers as a percent of the pre-recession peak in employment through the June report.
This data is only available back to 1994, so there is only data for three recessions. In October, he number of permanent job losers decreased to 2.126 million from 2.251 million in September. These jobs will likely be the hardest to recover, so it is a positive that the number of permanent job losers is declining rapidly
 • Seasonal Retail Hiring: Typically retail companies start hiring for the holiday season in October, and really increase hiring in November. But only a few temporary workers are hired in December. Here is a graph that shows the historical net retail jobs added for October, November and December by year.
Retailers hired 219 thousand workers Not Seasonally Adjusted (NSA) net in October. This was seasonally adjusted (SA) to a gain of 35 thousand jobs in October.
In 2020, retailers hired 356,800 employees (NSA) in November. That translated to a loss of 2,100 jobs SA.
If seasonal retail hiring is around 360,000 this year (NSA) that will translate to around zero jobs added (SA). It is possible that retailers hired for some jobs early (in October), and retail will be a negative in the November report (always difficult to predict).
• Conclusion: There is significant optimism concerning the November employment report, and many analysts are expecting a strong report. We have to be a little cautious because some of the apparent pickup in hiring might be for seasonal retail jobs.
Overall, the ADP report was solid and unemployment claims have been falling quickly.
As far as the pandemic, the number of daily cases during the reference week in November was around 80,000, down from around 90,000 in October. New cases per day peaked in early September and didn't start increasing again until the 2nd half of November - so there was some optimism during the November reference week.
My sense is the report will be above consensus expectations.
Hotels: Occupancy Rate Up 5% Compared to Same Week in 2019; Record Thanksgiving Week Occupancy
by Calculated Risk on 12/02/2021 10:44:00 AM
Note: Since occupancy declined sharply at the onset of the pandemic, CoStar is comparing to 2019.
From CoStar: STR: Thanksgiving Boosts US Weekly Hotel Performance
U.S. hotel performance came in higher than any other Thanksgiving week on record, according to STR‘s latest data through November 27.The following graph shows the seasonal pattern for the hotel occupancy rate using the four week average.
November 21-27, 2021 (percentage change from comparable week in 2019*):
• Occupancy: 53.0% (+4.6%)
• Average daily rate (ADR): $128.41 (+14.3%)
• Revenue per available room (RevPAR): $68.00 (+19.6%)
*Due to the steep, pandemic-driven performance declines of 2020, STR is measuring recovery against comparable time periods from 2019.
emphasis added
 Click on graph for larger image.
The red line is for 2021, black is 2020, blue is the median, dashed purple is 2019, and dashed light blue is for 2009 (the worst year on record for hotels prior to 2020).
Note: Y-axis doesn't start at zero to better show the seasonal change.
This was the first week with an increase over the same week in 2019.
The occupancy rate will now decline seasonally into the new year.
Weekly Initial Unemployment Claims Increase to 222,000
by Calculated Risk on 12/02/2021 08:34:00 AM
The DOL reported:
In the week ending November 27, the advance figure for seasonally adjusted initial claims was 222,000, an increase of 28,000 from the previous week's revised level. The previous week's level was revised down by 5,000 from 199,000 to 194,000. The 4-week moving average was 238,750, a decrease of 12,250 from the previous week's revised average. This is the lowest level for this average since March 14, 2020 when it was 225,500. The previous week's average was revised down by 1,250 from 252,250 to 251,000The following graph shows the 4-week moving average of weekly claims since 1971.
emphasis added
 Click on graph for larger image.
The dashed line on the graph is the current 4-week average. The four-week average of weekly unemployment claims decreased to 238,750.
The previous week was revised down.
Regular state continued claims decreased to 1,956,000 (SA) from 2,063,000 (SA) the previous week.
Weekly claims were well below the consensus forecast.
Wednesday, December 01, 2021
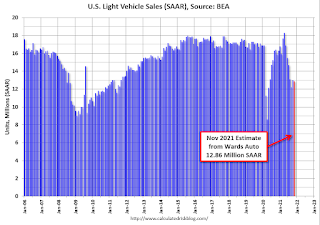
November Vehicles Sales decreased to 12.9 million SAAR
by Calculated Risk on 12/01/2021 06:28:00 PM
Wards Auto released their estimate of light vehicle sales for November. Wards Auto estimates sales of 12.86 million SAAR in November 2021 (Seasonally Adjusted Annual Rate), down 1.0% from the October sales rate, and down 19.0% from November 2020.
This was below the consensus estimate of 13.2 million SAAR.
 Click on graph for larger image.
This graph shows light vehicle sales since 2006 from the BEA (blue) and Wards Auto's estimate for November (red).
The impact of COVID-19 was significant, and April 2020 was the worst month.
After April 2020, sales increased, and were close to sales in 2019 (the year before the pandemic).
However, sales decreased earlier this year due to supply issues. It appears the "supply chain bottom" was in September, but sales in November were disappointing.
December 1st COVID-19: Holiday Impacted Data
by Calculated Risk on 12/01/2021 05:00:00 PM
The CDC is the source for all data.
According to the CDC, on Vaccinations. Total doses administered: 462,263,845.
| COVID Metrics | ||||
|---|---|---|---|---|
| Today | Week Ago | Goal | ||
| Percent fully Vaccinated | 59.4% | --- | ≥70.0%1 | |
| Fully Vaccinated (millions) | 197.4 | --- | ≥2321 | |
| New Cases per Day3 | 82,846 | 94,368 | ≤5,0002 | |
| Hospitalized3🚩 | 47,004 | 44,061 | ≤3,0002 | |
| Deaths per Day3 | 816 | 990 | ≤502 | |
| 1 Minimum to achieve "herd immunity" (estimated between 70% and 85%). 2my goals to stop daily posts, 37-day average for Cases, Currently Hospitalized, and Deaths 🚩 Increasing 7-day average week-over-week for Cases, Hospitalized, and Deaths ✅ Goal met. | ||||
IMPORTANT: For "herd immunity" most experts believe we need 70% to 85% of the total population fully vaccinated (or already had COVID). Note: COVID will probably stay endemic (at least for some time).
KUDOS to the residents of the 5 states that have achieved 70% of total population fully vaccinated: Vermont at 73.0%, Rhode Island, Connecticut, Maine, and Massachusetts at 71.3%.
KUDOS also to the residents of the 16 states and D.C. that have achieved 60% of total population fully vaccinated: New York at 68.6%, New Jersey, Maryland, Washington, Virginia, New Hampshire, Oregon, District of Columbia, New Mexico, Colorado, California, Minnesota, Pennsylvania, Illinois, Delaware, Florida, and Hawaii at 61.0%.
The following 19 states have between 50% and 59.9% fully vaccinated: Wisconsin at 59.6%, Nebraska, Iowa, Utah, Michigan, Texas, Kansas, Arizona, Nevada, South Dakota, North Carolina, Alaska, Ohio, Kentucky, Montana, Oklahoma, South Carolina, Missouri and Indiana at 50.6%.
Next up (total population, fully vaccinated according to CDC) are Georgia at 49.7%, Tennessee at 49.6%, Arkansas at 49.4%, Louisiana at 48.9% and North Dakota at 48.9%.
 Click on graph for larger image.
This graph shows the daily (columns) and 7-day average (line) of positive tests reported.


