 RSS Feed
 by Calculated Risk on 2/24/2022 08:36:00 AM
Thursday, February 24, 2022
Weekly Initial Unemployment Claims Decrease to 232,000
The DOL reported:
In the week ending February 19, the advance figure for seasonally adjusted initial claims was 232,000, a decrease of 17,000 from the previous week's revised level. The previous week's level was revised up by 1,000 from 248,000 to 249,000. The 4-week moving average was 236,250, a decrease of 7,250 from the previous week's revised average. The previous week's average was revised up by 250 from 243,250 to 243,500.The following graph shows the 4-week moving average of weekly claims since 1971.
emphasis added
 Click on graph for larger image.
The dashed line on the graph is the current 4-week average. The four-week average of weekly unemployment claims decreased to 236,250.
The previous week was revised up.
Weekly claims were close to the consensus forecast.
Q4 GDP Growth Revised up to 7.0% Annual Rate
by Calculated Risk on 2/24/2022 08:33:00 AM
From the BEA: Gross Domestic Product, Fourth Quarter and Year 2021 (Second Estimate)
Real gross domestic product (GDP) increased at an annual rate of 7.0 percent in the fourth quarter of 2021, according to the "second" estimate released by the Bureau of Economic Analysis. In the third quarter, real GDP increased 2.3 percent.Here is a Comparison of Second and Advance Estimates. PCE growth was revised down from 3.3% to 3.1%. Residential investment was revised up from -0.8% to 1.0%.
The GDP estimate released today is based on more complete source data than were available for the "advance" estimate issued last month. In the advance estimate, the increase in real GDP was 6.9 percent. The updated estimates primarily reflected upward revisions to nonresidential fixed investment, state and local government spending, and residential fixed investment that were partly offset by downward revisions to personal consumption expenditures (PCE) and exports.
emphasis added
Black Knight: National Mortgage Delinquency Rate Decreased in January; "Foreclosure Starts Surge"
by Calculated Risk on 2/24/2022 12:01:00 AM
Note: At the beginning of the pandemic, the delinquency rate increased sharply (see table below). Loans in forbearance are counted as delinquent in this survey, but those loans are not reported as delinquent to the credit bureaus.
From Black Knight: Black Knight: Foreclosure Starts Surge Sevenfold in January, Hitting Highest Level in Two Years; Though Volumes Rising, Still 20% Below Pre-Pandemic Levels
• Foreclosure starts rose sharply in January as borrower protections in place throughout the economic recovery begin to roll off, with 32,900 loans referred to foreclosure in the monthAccording to Black Knight's First Look report, the percent of loans delinquent decreased 2.3% in January compared to December and decreased 44% year-over-year.
• While up significantly from December’s 4,100, January’s start volume was still more than 20% below the 42,800 in January 2020, prior to the onset of the COVID-19 pandemic
• Roughly half of the month’s starts were among borrowers who were already delinquent prior to the economic impacts of COVID-19, and half from borrowers who became past due in March 2020 or later
• In turn, the national foreclosure rate rose to its highest level since May 2021 (0.28%) – still nearly 40% below its pre-pandemic level, with foreclosure sales (completions) 70% below January 2020 levels
• At the same time, the national delinquency rate continued to improve, and the number of seriously past due mortgages fell by 87,000 (-9%) as borrowers leaving forbearance plans returned to making payments
• A backlog of post-forbearance loans in active loss mitigation – plus another 379,000 that have finished loss mitigation but remain past due – calls for a close watch on foreclosure metrics in coming months
• Prepayment activity hit a more than two-year low, falling by 24% from the month prior as rising rates continue to put sharp downward pressure on refinance incentive
emphasis added
The percent of loans in the foreclosure process increased 16.5% in January and were down 13% over the last year.
Black Knight reported the U.S. mortgage delinquency rate (loans 30 or more days past due, but not in foreclosure) was 3.30% in January, down from 3.38% in December.
The percent of loans in the foreclosure process increased in January to 0.28%, from 0.24% in December.
The number of delinquent properties, but not in foreclosure, is down 1,372,000 properties year-over-year, and the number of properties in the foreclosure process is down 22,000 properties year-over-year.
| Black Knight: Percent Loans Delinquent and in Foreclosure Process | ||||
|---|---|---|---|---|
| Jan 2022 | Dec 2021 | Jan 2021 | Jan 2020 | |
| Delinquent | 3.30% | 3.38% | 5.85% | 3.22% |
| In Foreclosure | 0.28% | 0.24% | 0.32% | 0.46% |
| Number of properties: | ||||
| Number of properties that are delinquent, but not in foreclosure: | 1,758,000 | 1,799,000 | 3,130,000 | 1,705,000 |
| Number of properties in foreclosure pre-sale inventory: | 149,000 | 128,000 | 171,000 | 246,000 |
| Total Properties | 1,907,000 | 1,927,000 | 3,301,000 | 2,047,000 |
Wednesday, February 23, 2022
Thursday: New Home Sales, GDP, Unemployment Claims
by Calculated Risk on 2/23/2022 09:00:00 PM
Thursday:
• At 8:30 AM ET, the initial weekly unemployment claims report will be released. The consensus is for a decrease to 240 thousand from 248 thousand last week.
• Also, at 8:30 AM, Gross Domestic Product, 4th quarter 2021 (Second estimate). The consensus is that real GDP increased 7.0% annualized in Q4, up from the advance estimate of 6.9%.
• Also, at 8:30 AM, Chicago Fed National Activity Index for January. This is a composite index of other data.
• At 10:00 AM, New Home Sales for January from the Census Bureau. The consensus is that new home sales decreased to 807 thousand SAAR, down from 811 thousand in December.
• At 11:00 AM, the Kansas City Fed manufacturing survey for February
On COVID (focus on hospitalizations and deaths):
| COVID Metrics | ||||
|---|---|---|---|---|
| Now | Week Ago | Goal | ||
| Percent fully Vaccinated | 64.8% | --- | ≥70.0%1 | |
| Fully Vaccinated (millions) | 215.1 | --- | ≥2321 | |
| New Cases per Day3 | 79,539 | 133,392 | ≤5,0002 | |
| Hospitalized3 | 56,222 | 77,791 | ≤3,0002 | |
| Deaths per Day3 | 1,602 | 2,096 | ≤502 | |
| 1 Minimum to achieve "herd immunity" (estimated between 70% and 85%). 2my goals to stop daily posts, 37-day average for Cases, Currently Hospitalized, and Deaths 🚩 Increasing 7-day average week-over-week for Cases, Hospitalized, and Deaths ✅ Goal met. | ||||
 Click on graph for larger image.
This graph shows the daily (columns) and 7-day average (line) of deaths reported.
New cases, hospitalizations and deaths are now declining.
"Mortgage Rates Hit New Multi-Year Highs"; Highest Since 2019
by Calculated Risk on 2/23/2022 04:59:00 PM
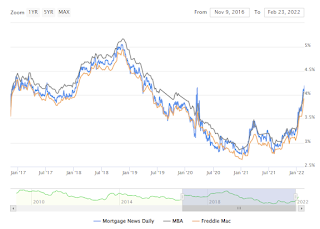
From Matthew Graham at MortgageNewsDaily: Mortgage Rates Hit New Multi-Year Highs
It was another bad day for the mortgage market. This has been the norm so far in 2022 as financial markets continue repositioning for less and less support from the Federal Reserve.
There were no major new developments on that front today. Bonds (which underlie mortgage rates) simply drifted into moderately weaker territory. In so doing, they ignored several potential justifications to improve. This gives the impression that rates simply took an opportunity to catch their breath as investors weighed the implications of geopolitical risk surrounding Ukraine.
Today's average mortgage rates aren't significantly higher than the previous highs, but nonetheless the highest we've seen since May 2019. The average conventional 30yr fixed is now closer to 4.25% than 4.125%
 Click on graph for larger image.
This is a graph from Mortgage News Daily (MND) showing 30-year fixed rates from three sources (MND, MBA, Freddie Mac) since 2010.
The 30-year fixed rate for top tier scenarios was 4.19% today, up from 4.12% on Tuesday.
This is the highest rate since May 2019,
Go to MND and you can adjust the graph for different time periods.
Real House Prices, Price-to-Rent Ratio and Price-to-Median Income in December and a look at "Affordability"
by Calculated Risk on 2/23/2022 10:53:00 AM
Today, in the Calculated Risk Real Estate Newsletter: Real House Prices, Price-to-Rent Ratio and Price-to-Median Income in December
Excerpt:
In October 2004, Fed economist John Krainer and researcher Chishen Wei wrote a Fed letter on price to rent ratios: House Prices and Fundamental Value. Kainer and Wei presented a price-to-rent ratio using the OFHEO house price index and the Owners' Equivalent Rent (OER) from the BLS.
Note that OER is lagging behind other measures of recent rent increases.
Here is a similar graph using the Case-Shiller National and Composite 20 House Price Indexes. This graph shows the price to rent ratio (January 2000 = 1.0). The price-to-rent ratio had been moving more sideways but picked up significantly recently.On a price-to-rent basis, the Case-Shiller National index is at a record high, and the Composite 20 index is back to June 2005 levels.
By all of the above measures, house prices appear elevated.
emphasis added

There is much more in the article. You can subscribe at https://calculatedrisk.substack.com/
AIA: "Architecture billings continue growth" in January
by Calculated Risk on 2/23/2022 08:52:00 AM
Note: This index is a leading indicator primarily for new Commercial Real Estate (CRE) investment.
From the AIA: Architecture billings continue growth into 2022
Architecture firms began 2022 with a slight improvement in business conditions, according to a new report today from The American Institute of Architects (AIA).
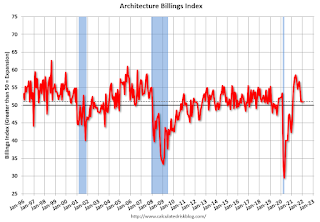
AIA’s Architecture Billings Index (ABI) score for January was 51.0 compared to 51.0 in December (any score over 50 indicates billings growth). Inquiries into new work and the value of new design contracts both remained strong with scores of 61.9 and 56.1 respectively.
“Architecture billings, while remaining at very healthy levels in recent months, have slowed considerably from the middle of last year,” said AIA Chief Economist, Kermit Baker, Hon. AIA, PhD. “This no doubt reflects delays in the construction sector caused by supply challenges for both labor and materials, as well as ongoing staffing constraints at architecture firms.”
...
• Regional averages: South (61.2); Midwest (51.5); West (47.6); Northeast (46.8)
• Sector index breakdown: mixed practice (59.3); commercial/industrial (54.2); multi-family residential (50.1); institutional (47.3)
emphasis added
 Click on graph for larger image.
This graph shows the Architecture Billings Index since 1996. The index was at 51.0 in January, unchanged from 51.0 in December. Anything above 50 indicates expansion in demand for architects' services.
Note: This includes commercial and industrial facilities like hotels and office buildings, multi-family residential, as well as schools, hospitals and other institutions.
This index has been positive for the last twelve months.
This index usually leads CRE investment by 9 to 12 months, so this index suggests a pickup in CRE investment in 2022.
MBA: Mortgage Applications Decrease in Latest Weekly Survey
by Calculated Risk on 2/23/2022 07:00:00 AM
From the MBA: Mortgage Applications Decrease in Latest MBA Weekly Survey
Mortgage applications decreased 13.1 percent from one week earlier, according to data from the Mortgage Bankers Association’s (MBA) Weekly Mortgage Applications Survey for the week ending February 18, 2022.
... The Refinance Index decreased 16 percent from the previous week and was 56 percent lower than the same week one year ago. The seasonally adjusted Purchase Index decreased 10 percent from one week earlier. The unadjusted Purchase Index decreased 6 percent compared with the previous week and was 6 percent lower than the same week one year ago.
Mortgage applications dropped to their lowest level since December 2019 last week, as mortgage rates continued to inch higher. The 30-year fixed rate was 4.06 percent, almost a full percentage point higher than a year ago. Higher mortgage rates have quickly shut off refinances, with activity down in six of the first seven weeks of 2022. Conventional refinances in particular saw a 17 percent decrease last week,” said Joel Kan, MBA’s Associate Vice President of Economic and Industry Forecasting. “Purchase applications, already constrained by elevated sales prices and tight inventory, have also been impacted by these higher rates and declined for the third straight week. While the average loan size did not increase this week, it remained close to the survey’s record high.”
...
The average contract interest rate for 30-year fixed-rate mortgages with conforming loan balances ($647,200 or less) increased to 4.06 percent from 4.05 percent, with points increasing to 0.48 from 0.45 (including the origination fee) for 80 percent loan-to-value ratio (LTV) loans.
emphasis added
 Click on graph for larger image.
The first graph shows the refinance index since 1990.
With higher mortgage rates, the refinance index has declined sharply over the last several months and is at the lowest level since December 2019.
The second graph shows the MBA mortgage purchase index
 According to the MBA, purchase activity is down 6% year-over-year unadjusted.
Note: Red is a four-week average (blue is weekly).
Tuesday, February 22, 2022
"Mortgage Rates Edging Back Up Toward Long-Term Highs"
by Calculated Risk on 2/22/2022 09:01:00 PM
From Matthew Graham at Mortgage News Daily: Mortgage Rates Edging Back Up Toward Long-Term Highs
The average lender is now roughly 0.04 higher than they were on Friday afternoon, but not yet back to the recent multi-year highs seen at the beginning of last week. That said, they're close enough to those highs that the average borrower won't be able to see a difference in this afternoon's loan quote. [30 year fixed 4.12%]Wednesday:
emphasis added
• At 7:00 AM ET, The Mortgage Bankers Association (MBA) will release the results for the mortgage purchase applications index.
• During the day: The AIA's Architecture Billings Index for January (a leading indicator for commercial real estate).
On COVID (focus on hospitalizations and deaths):
| COVID Metrics | ||||
|---|---|---|---|---|
| Now | Week Ago | Goal | ||
| Percent fully Vaccinated | 64.8% | --- | ≥70.0%1 | |
| Fully Vaccinated (millions) | 215.0 | --- | ≥2321 | |
| New Cases per Day3 | 78,306 | 145,931 | ≤5,0002 | |
| Hospitalized3 | 80,185 | 107,772 | ≤3,0002 | |
| Deaths per Day3 | 1,597 | 2,228 | ≤502 | |
| 1 Minimum to achieve "herd immunity" (estimated between 70% and 85%). 2my goals to stop daily posts, 37-day average for Cases, Currently Hospitalized, and Deaths 🚩 Increasing 7-day average week-over-week for Cases, Hospitalized, and Deaths ✅ Goal met. | ||||
 Click on graph for larger image.
This graph shows the daily (columns) and 7-day average (line) of deaths reported.
New cases, hospitalizations and deaths are now declining.
Note: Hospitalizations have not been updated for a week and are certainly lower than in the table.
February Vehicle Sales Forecast: Decrease to 14.2 million SAAR
by Calculated Risk on 2/22/2022 06:33:00 PM
From WardsAuto: Volume Up But February’s U.S. Light-Vehicle SAAR Set to Decline from January (pay content)
Supply issues continue to impact vehicle sales, but it appears the supply chain disruption bottom is in.
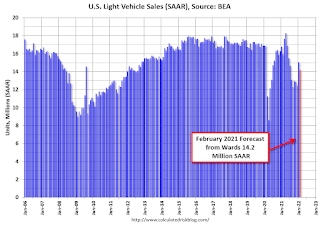
This graph shows actual sales from the BEA (Blue), and Wards forecast for January (Red).
The Wards forecast of 14.2 million SAAR, would be down about 6% from last month, and down 11% from a year ago (sales were solid in February 2021, as sales recovered from the depths of the pandemic, and weren't yet impacted by supply chain issues).


