 RSS Feed
 by Calculated Risk on 5/11/2023 04:15:00 PM
Thursday, May 11, 2023
Realtor.com Reports Weekly Active Inventory Up 31% YoY; New Listings Down 16% YoY
Realtor.com has monthly and weekly data on the existing home market. Here is their weekly report from chief economist Danielle Hale: Weekly Housing Trends View — Data Week Ending May 6, 2023
• Active inventory was up at a slower pace, with for-sale homes up just 31% above one year ago. The number of homes for sale continues to grow, but compared to one year ago, the pace is slowing.
...
• New listings–a measure of sellers putting homes up for sale–were down again this week, by 16% from one year ago. The number of newly listed homes has been lower than the same time the previous year for the past 44 weeks.
 Here is a graph of the year-over-year change in inventory according to realtor.com.
 Inventory is still up year-over-year - from record lows - however, the YoY increase has slowed sharply recently.
This was the smallest YoY increase since October.
The recent trend suggests active inventory could be down YoY in Q3!
Part 1: Current State of the Housing Market; Overview for mid-April
by Calculated Risk on 5/11/2023 12:35:00 PM
Today, in the Calculated Risk Real Estate Newsletter: Part 1: Current State of the Housing Market; Overview for mid-April
A brief excerpt:
Interestingly, new home inventory is essentially at a record percentage of total inventory. This graph uses Not Seasonally Adjusted (NSA) existing home inventory from the National Association of Realtors® (NAR) and new home inventory from the Census Bureau (only completed and under construction inventory).There is much more in the article. You can subscribe at https://calculatedrisk.substack.com/
Note: Mark Fleming, Chief Economist at First American pointed this out in March.
It took a number of years following the housing bust for new home inventory to return to the pre-bubble percent of total inventory. Then, with the pandemic, existing home inventory collapsed and now the percent of new homes is over 25% of total for sale inventory. The lack of existing home inventory, and few distressed sales, has been a positive for homebuilders.

MBA: "Mortgage Delinquency Rate in First-Quarter 2023 Declines to Second-Lowest Level in MBA’s Survey"
by Calculated Risk on 5/11/2023 10:19:00 AM
From the MBA: Mortgage Delinquency Rate in First-Quarter 2023 Declines to Second-Lowest Level in MBA’s Survey
The delinquency rate for mortgage loans on one-to-four-unit residential properties decreased to a seasonally adjusted rate of 3.56 percent of all loans outstanding at the end of the first quarter of 2023, according to the Mortgage Bankers Association’s (MBA) National Delinquency Survey.
The delinquency rate was down 40 basis points from the fourth quarter of 2022 and down 55 basis points from one year ago. The percentage of loans on which foreclosure actions were started in the first quarter rose by 2 basis points to 0.16 percent.
“The mortgage delinquency rate fell to its lowest level for any first quarter since MBA’s survey began in 1979 and was the second lowest quarterly rate overall, just 11 basis points above the survey low in the third quarter of 2022,” said Marina Walsh, CMB, MBA’s Vice President of Industry Analysis. “Mortgage delinquencies and the unemployment rate continue to track each other closely, with the unemployment rate in April falling back to the 54-year low of 3.4 percent set in January.”
Added Walsh, “Consistent with the resilient job market, the performance of existing mortgages is exceeding expectations. Across all states, there was an improvement in the first quarter compared to one year ago. Year-over-year delinquencies for all product types – FHA, VA, and conventional – were also down.”.
emphasis added
 Click on graph for larger image.
This graph shows the percent of loans delinquent by days past due. Overall delinquencies decreased in Q1.
From the MBA:
Compared to last quarter, the seasonally adjusted mortgage delinquency rate decreased for all loans outstanding. By stage, the 30-day delinquency rate decreased 15 basis points to 1.77 percent, the 60-day delinquency rate decreased 11 basis points to 0.55 percent, and the 90-day delinquency bucket decreased 14 basis points to 1.24 percent.The sharp increase in 2020 in the 90-day bucket was due to loans in forbearance (included as delinquent, but not reported to the credit bureaus).
The delinquency rate includes loans that are at least one payment past due but does not include loans in the process of foreclosure. The percentage of loans in the foreclosure process at the end of the first quarter was 0.57 percent, unchanged from the fourth quarter of 2022 and 4 basis points higher than one year ago.
The percent of loans in the foreclosure process increased slightly year-over-year in Q1 with the end of the foreclosure moratoriums but are still historically low.
Weekly Initial Unemployment Claims increase to 264,000
by Calculated Risk on 5/11/2023 08:32:00 AM
The DOL reported:
In the week ending May 6, the advance figure for seasonally adjusted initial claims was 264,000, an increase of 22,000 from the previous week's unrevised level of 242,000. This is the highest level for initial claims since October 30, 2021 when it was 264,000. The 4-week moving average was 245,250, an increase of 6,000 from the previous week's unrevised average of 239,250. This is the highest level for this average since November 20, 2021 when it was 249,250.The following graph shows the 4-week moving average of weekly claims since 1971.
emphasis added
 Click on graph for larger image.
The dashed line on the graph is the current 4-week average. The four-week average of weekly unemployment claims increased to 245,250.
The previous week was unrevised.
Weekly claims were above the consensus forecast.
Wednesday, May 10, 2023
Thursday: Unemployment Claims, PPI
by Calculated Risk on 5/10/2023 09:01:00 PM
 Note: Mortgage rates are from MortgageNewsDaily.com and are for top tier scenarios.
Thursday:
• At 8:30 AM ET, The initial weekly unemployment claims report will be released. The consensus is for 250 thousand initial claims, up from 242 thousand last week.
• Also at 8:30 AM, The Producer Price Index for April from the BLS. The consensus is for a 0.3% increase in PPI, and a 0.3% increase in core PPI.
Misery Index
by Calculated Risk on 5/10/2023 03:33:00 PM
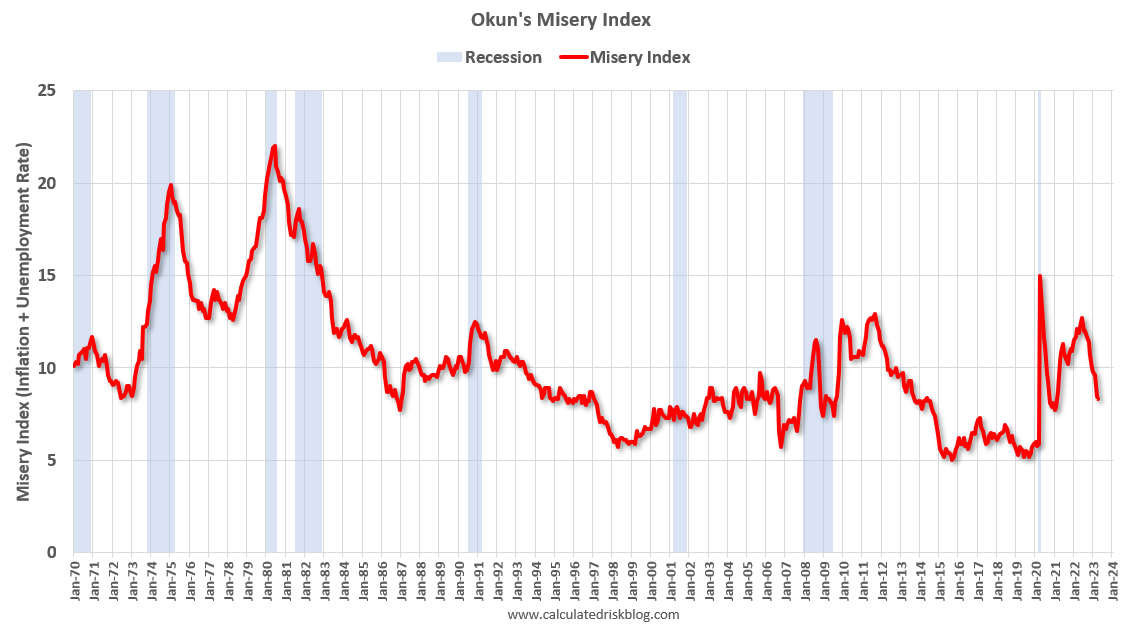
For fun, here is an update to the graph of economist Arthur Okun's misery index (popularized by President Reagan).
Okun added inflation and the unemployment rate together as a measure of "misery".
 Click on graph for larger image.
Currently YoY inflation is at 4.9%, and the unemployment rate is at 3.4% for a "misery index" value of 8.3.
This is down from 8.5 in March, and below the median of 9.6 over the last 50 years.
The all-time low was 5.0 during Obama's 2nd term.
2nd Look at Local Housing Markets in April
by Calculated Risk on 5/10/2023 01:34:00 PM
Today, in the Calculated Risk Real Estate Newsletter: 2nd Look at Local Housing Markets in April
A brief excerpt:
This is the second look at local markets in I’m tracking about 40 local housing markets in the US. Some of the 40 markets are states, and some are metropolitan areas. I’ll update these tables throughout the month as additional data is released.There is much more in the article. You can subscribe at https://calculatedrisk.substack.com/
Closed sales in April were mostly for contracts signed in February and March. Since 30-year fixed mortgage rates were over 6% for all of February and March - compared to the 4% range the previous year - closed sales were down significantly year-over-year in April.
It is likely sales were down more year-over-year in April than in March, however, the impact was probably not as severe as for closed sales in December and January (rates were the highest in October and November 2022 when contracts were signed for closing in December and January).
...
In April, sales in these markets were down 30.7%. In March, these same markets were down 24.0% YoY Not Seasonally Adjusted (NSA).
This is a larger YoY decline NSA than in March for these markets, however there was one less selling day in April this year. This early data suggests the April existing home sales report will show another significant YoY decline, and the 20th consecutive month with a YoY decline in sales.
Many more local markets to come!

Cleveland Fed: Median CPI increased 0.4% and Trimmed-mean CPI increased 0.3% in April
by Calculated Risk on 5/10/2023 11:27:00 AM
The Cleveland Fed released the median CPI and the trimmed-mean CPI.
According to the Federal Reserve Bank of Cleveland, the median Consumer Price Index rose 0.4% in April. The 16% trimmed-mean Consumer Price Index increased 0.3% in April. "The median CPI and 16% trimmed-mean CPI are measures of core inflation calculated by the Federal Reserve Bank of Cleveland based on data released in the Bureau of Labor Statistics’ (BLS) monthly CPI report".
 Click on graph for larger image.
This graph shows the year-over-year change for these four key measures of inflation.
On a year-over-year basis, the median CPI rose 7.0%, the trimmed-mean CPI rose 6.1%, and the CPI less food and energy rose 5.5%. Core PCE is for March and increased 4.6% year-over-year.
Note: The Cleveland Fed released the median CPI details. "Used Cars" increased at a 69% annualized rate in April (this will reverse in May), and "Car and truck rental" decreased at a 33% annualized rate.
Note that Owners' Equivalent Rent and Rent of Primary Residence account for 1/3 of median CPI, and these measures were up almost 7% annualized. This data is lagged and asking rents have softened in recent months (due to the sharp slowdown in household formation).
YoY Measures of Inflation: Services, Goods and Shelter
by Calculated Risk on 5/10/2023 08:51:00 AM
Here a few measures of inflation:
The first graph is the one Fed Chair Powell has been mentioning.
 Click on graph for larger image.
This graph shows the YoY price change for Services and Services less rent of shelter through March 2023.
Services were up 6.8% YoY as of April 2023, down from 7.2% YoY in March.
Services less rent of shelter was up 5.2% YoY in April, down from 6.1% YoY in March.
Services less rent of shelter was up 5.2% YoY in April, down from 6.1% YoY in March.
Will services ex-shelter inflation be persistent, or will it follow a similar pattern as goods? This is a topic I discussed in Pandemic Economics, Housing and Monetary Policy: Part 2.
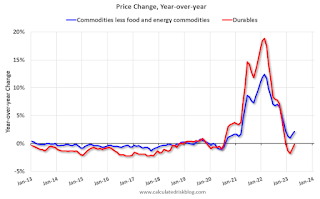 The second graph shows that goods prices started to increase year-over-year (YoY) in 2020 and accelerated in 2021 due to both strong demand and supply chain disruptions.
 The second graph shows that goods prices started to increase year-over-year (YoY) in 2020 and accelerated in 2021 due to both strong demand and supply chain disruptions.
Durables were at -0.2% YoY as of April 2023, up from -1.0% YoY in March.
Commodities less food and energy commodities were up 2.1% YoY in April, up from 1.6% YoY in March.
Commodities less food and energy commodities were up 2.1% YoY in April, up from 1.6% YoY in March.
Goods inflation was transitory.
 Here is a graph of the year-over-year change in shelter from the CPI report (through April) and housing from the PCE report (through March 2023)
Shelter was up 8.1% year-over-year in March, down from 8.2% in March. Housing (PCE) was up 8.3% YoY in March.
The BLS noted this morning: "The index for shelter was the largest contributor to the monthly all items increase ..."
BLS: CPI increased 0.4% in April; Core CPI increased 0.4%
by Calculated Risk on 5/10/2023 08:32:00 AM
The Consumer Price Index for All Urban Consumers (CPI-U) rose 0.4 percent in April on a seasonally adjusted basis, after increasing 0.1 percent in March, the U.S. Bureau of Labor Statistics reported today. Over the last 12 months, the all items index increased 4.9 percent before seasonal adjustment.CPI was slightly lower than expected and core CPI slightly higher than expectations. I'll post a graph later today after the Cleveland Fed releases the median and trimmed-mean CPI.
The index for shelter was the largest contributor to the monthly all items increase, followed by increases in the index for used cars and trucks and the index for gasoline. The increase in the gasoline index more than offset declines in other energy component indexes, and the energy index rose 0.6 percent in April. The food index was unchanged in April, as it was in March. The index for food at home fell 0.2 percent over the month while the index for food away from home rose 0.4 percent.
The index for all items less food and energy rose 0.4 percent in April, as it did in March. Indexes which increased in April include shelter, used cars and trucks, motor vehicle insurance, recreation, household furnishings and operations, and personal care. The index for airline fares and the index for new vehicles were among those that decreased over the month.
The all items index increased 4.9 percent for the 12 months ending April; this was the smallest 12-month increase since the period ending April 2021. The all items less food and energy index rose 5.5 percent over the last 12 months. The energy index decreased 5.1 percent for the 12 months ending April, and the food index increased 7.7 percent over the last year.
emphasis added


