by Calculated Risk on 3/28/2005 03:19:00 AM
Monday, March 28, 2005
Price-Rent Ratio: USA and San Diego
I posted a Price-Rent ratio for the US on Angry Bear:"Housing: Speculation and the Price-Rent Ratio". The following is the same calculation for San Diego (one of the hottest RE markets).
Click on graph for larger image.
The price component is from the OFHEO home price index for San Diego-Carlsbad-San Marcos and the rent series is from the BLS San Diego owner’s equivalent rent index.
Obviously San Diego has seen more recent appreciation. San Diego also experiences more volatility, but that is expected since the US is an average of many areas.
More on Housing Speculation
by Calculated Risk on 3/28/2005 01:13:00 AM
My most recent post is up on Angry Bear: Housing: Speculation and the Price-Rent Ratio
For a running list of News links on housing, see Patrick's Housing Crash site.
For an interesting graph and some great quotes, see Mish's "It's a Totally New Paradigm".
UPDATE: Another interesting article quoting Merrill Lynch chief economist David Rosenberg and Dean Baker, co-director of the Center for Economic & Policy Research: Bubble in housing will burst
Best to all.
Friday, March 25, 2005
Free Money!
by Calculated Risk on 3/25/2005 03:45:00 PM
Come and get it. Price doesn't matter. Interest rates don't matter. They're giving away free money, right here in Orange County, California. Just buy a home, wait a year, and put the cash in your pocket!
At least that was my reaction to this story in the OC Register: "Loan rates on the rise". The story quotes Gary Watts, a Mission Viejo "real-estate broker and economist" as expressing
... his enthusiasm this way: The recent $100 increase in monthly payments - or $1,200 a year - is nothing compared to what he predicts is Orange County home-price appreciation potential: as much as $70,000 a year.A simple calculation: The median home price in OC is $555,000. With 10% down, a buyer's monthly payment for P&I would be $2997.97 (plus property taxes of about $500 /month). This is based on a 30 year fixed rate loan at 6.01% (see FreddieMac)
"There's too much emphasis on interest rates in the marketplace," Watts said. "Who wouldn't trade $1,200 for $70,000?"
By my calculation, a speculator's first year risk is: $41.5K + their $55.5K down payment = $97K (minus the utility of the property), not $1200. Of course, with a 1 Year ARM (currently 4.24%) a speculator is only risking $35K + $55.5K = $90.5K (minus utility). And if the speculator can obtain a no money down loan, they are only risking the monthly payments minus the net rental income (or other utility if they occupy the house).
And what is the likelihood that houses in OC will appreciate $70K over the next year? Is there always a greater fool?
Thursday, March 24, 2005
New Home Sales Rebound in February
by Calculated Risk on 3/24/2005 10:38:00 AM
According to a Census Bureau report, New Home Sales rebounded in February to a seasonally adjust annual rate of 1.126 million.
Sales of new one-family houses in February 2005 were at a seasonally adjusted annual rate of 1,226,000, according to estimates released jointly today by the U.S. Census Bureau and the Department of Housing and Urban Development. This is 9.4 percent (±14.7%)* above the revised January rate of 1,121,000 and is 5.2 percent (±13.3%)* above the February 2004 estimate of 1,165,000.
The median sales price of new houses sold in February 2005 was $230,700; the average sales price was $288,400. The seasonally adjusted estimate of new houses for sale at the end of February was 444,000. This represents a supply of 4.4 months at the current sales rate.

Click on Graph for larger image.
The New Home Sales report shows no sign of a slowdown.
Wednesday, March 23, 2005
Refinance Applications Down 60% from Last Year
by Calculated Risk on 3/23/2005 07:06:00 PM
Mortgage applications were down 9.5% last week according to the Mortgage Bankers Association (MBA). According to their press release:
The Market Composite Index - a measure of mortgage loan application volume - was 658.8, an decrease of 9.5 percent on a seasonally adjusted basis from 727.6 one week earlier. On an unadjusted basis, the Index decreased 9.2 percent compared with last week but was down 39.3 percent compared with the same week one year earlier.My emphasis added. Is this the beginning of the end of mortgage equity extraction?
"The increase in mortgage rates has reduced application activity across the board, particularly for refinances. Refinance applications are down more than 60 percent relative to this time last year," said Michael Fratantoni, MBA's senior director of single family research and economics.
Tuesday, March 22, 2005
Forbes: Homeowners in Hock
by Calculated Risk on 3/22/2005 09:24:00 PM
This month's Forbes has an article about homeowners extracting equity from thier homes to "finance consumer expenditures". The article discusses several issues: the low savings rate, noting that "the personal savings rate has fallen from 6% of GDP 12 years ago to a mere 1% now", mortgage equity extraction (with a nice chart), and they hint at the link between equity extraction and the trade deficit.
If Forbes had taken the next step, they would have compared equity extraction to GDP growth (see: "Mortgage Debt and the Trade Deficit") and they would have asked what is the impact on trade and GDP if housing slows (see my musings "Housing and Trade: Virtuous Cycle about to Become Vicious?")
If housing slows that will end the equity extraction game. With rising interest rates and higher energy costs, a housing slow down is probably imminent and inevitable. Trying to determine the impact of an impending housing slow down on the general economy is the next puzzle.
Monday, March 21, 2005
Guest Bloggin' on Angry Bear
by Calculated Risk on 3/21/2005 01:24:00 AM
I've been invited to be a guest blogger on the Angry Bear. I will be posting on Mondays.
Here is my first (and hopefully not last) post: "Another Budget, Another Disaster".
A little introspection: What am I trying to accomplish with blogging? Initially I just wanted to understand what blogging was all about. Then I wanted to improve my writing skills (still working on that) and my understanding of economics (a hobby and a passion for me).
But most of all, I'm hopeful that the Internet and blogging will bring the America I love and believe in, back to the fore. Blogging is the 21st century pamphleteering and sometimes (offered in all humbleness) I sense the ghost of Thomas Paine.
Best Regards to all!
Saturday, March 19, 2005
Housing and Trade: Virtuous Cycle about to Become Vicious?
by Calculated Risk on 3/19/2005 09:33:00 PM
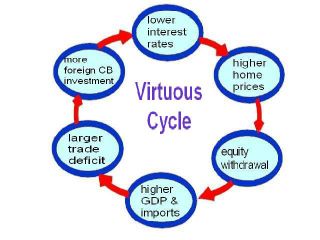
There appears to be a relationship between housing and the trade deficit as suggested by the 2nd graph in this earlier post. Perhaps we have seen a Virtuous Cycle as depicted in the following diagram: Click on diagram for larger image.
Starting from the top: There is no question that lower interest rates have led to an increase in housing prices. And those higher housing prices have led to an ever increasing equity withdrawal by homeowners.
A few numbers: Total mortgage debt increased $900 Billion in 2004 and $733 Billion in 2003; a significant increase from the $200 Billion in '97. In another measure called MEW "Mortgage Equity Withdrawal" (that is used in the UK), Goldman Sachs senior economist Jan Hatzius has calculated (reg. required) that homeowners have pulled $640 Billion from their homes in 2004, as compared to just $74 Billion ten years ago.
Since the savings rate has declined, it is reasonable to assume that a large percentage of this equity withdrawal has flowed to consumption, increasing both GDP and imports over the last few years. Since the annual increase in mortgage debt has exceeded GDP growth for four consecutive years (see graph 1), a large portion of this equity withdrawal has flowed to consumption of imports. Therefore it appears mortgage equity withdrawal has been a meaningful contributor to the ever widening trade and current account deficits.
To finance the current account deficit, foreign Central Banks (CBs) have been investing heavily in dollar denominated securities. Some analysts have suggested that these investments have lowered interest rates by between 40 bps and 200 bps (Roubini and Setser: "Will the Bretton Woods 2 Regime Unravel Soon? The Risk of a Hard Landing in 2005-2006")
If these analysts are correct, and foreign CB intervention is lowering treasury yields, then this has also lowerered mortgage interest rates ... and the cycle repeats. The result: a Virtuous Cycle with higher housing prices, more consumption and lower interest rates.
As a result of the rapidly increasing housing prices, we are now seeing significant speculation, excessive leverage and poor credit quality of new homebuyers; all the signs of an overheated market. As an example, in this article "Miami's Changing Skyline: Boom Or Bust?", a Raymond James and Associates representative is quoted as saying: "as much as 85 percent of all condominium sales in the downtown Miami market are accounted for by investors and speculators." What happens if the housing market cools down?
The Vicious Cycle
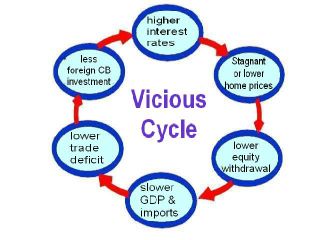
The following diagram depicts the possible unwinding of the current cycle.
If housing cools down (prices do not need to collapse), this will lead to lower equity withdrawal. In turn this will lead to a slow down in GDP growth and lower imports.
Lower imports might lead to a lower trade deficit, depending on the strength of exports. This could lead to less foreign CB investment in dollar denominated assets. And this could lead to higher interest rates followed by lower housing prices and the cycle repeats.
The result: a Vicious Cycle with lower housing prices, less consumption and higher interest rates.
Thursday, March 17, 2005
Senator Reid: An Online Interview
by Calculated Risk on 3/17/2005 10:29:00 PM
Democratic Senator and Minority Leader Harry Reid (D-Nev) gave an interview to a blogger this week. The interview is worth reading and I would like to highlight a couple of points:
Sen. Reid on the budget:
... –this budget–everything is being put to the back burner except these tax cuts being made permanent. This document should be filed under fiction in the Library of Congress because they don’t include the costs of the ongoing war in Iraq, they don’t list there the tax cuts, what that cost is going to be over the years; it doesn’t take into consideration so many different things, Social Security costs, and for the first time in the history of the country, they’re doing a budget on a five year budget rather than a ten year because if you look past five years its even more bleak than the first five years.And on the media and the Internet:
Raw Story: I think it’s significant that you’re giving an interview to us as an online site. I’m curious as to what your opinions are on the role of blogs and where you see them in the political ecosystem.
Sen. Reid:
I personally believe that much of what goes on in America today is governed by wealth and power. That if you look at what’s happened with the newspapers over the years, during the days of the founding fathers, they used to post newspapers in public squares and people who couldn’t read had the papers read to them. The Federalist Papers were a way of communicating; people read and learned. Well, when the radio came along, it changed it a little bit, but you still had the Fairness Doctrine so you didn’t have to worry. Really, the beginning came in the early 1950s; I think it was ‘52 or ‘53 when the networks decided to go to half-hour news programs. Then people stopped reading the newspapers even more. But on television you had the Fairness Doctrine.My emphasis added.
What has happened in recent years, the Fairness Doctrine has been taken away, that is, equal time for pros and cons on an issue. And they also allowed the concentration of media power, so one station, one owner can own 1,200 radio stations. What this means is that wealth and power control most everything in this country. But one thing they do not control–wealth and power does not control the Internet. Through the Internet, regular ordinary people have a voice. That’s why I go out of my way to communicate any way that I can on the Internet and I think the blogs are a tremendously important way for the American public to find out what’s really going on.
I agree with Sen. Reid's comments on the budget and the media. Read the entire interview here.
Tuesday, March 15, 2005
California Real Estate Prices: Boom and Bust
by Calculated Risk on 3/15/2005 11:39:00 PM
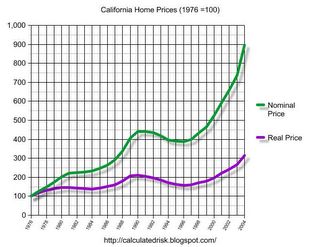
Today I heard someone comment that California Real Estate never goes down. In fact, California RE has declined in the past in both real and nominal terms.
Click on graph for larger image.
This graph shows the price of California RE based on the OFHEO California housing index. For the real price, the nominal price is adjusted by CPI, less Shelter, from the BLS.(1976 = 100)
The graph shows that in real terms we have seen two declines since 1980. The first decline, in the early '80s, lasted 3 years. The second decline, in the early to mid '90s, lasted 6 years.
The second graph shows the same information by annual rate of return, both real and nominal.
The decline in the '90s lasted 24 quarters from peak to trough. It took 9 years for prices to recover in nominal terms to their early '91 peak. Overall prices declined 12% in nominal terms and 26% in real terms.
Even more important for the economy are the coincident declines in sales volume. Real Estate prices are “sticky downward” since sellers are slow to adjust their prices down, and buyers are reluctant to buy a declining price asset. In this regards, real estate is an imperfect market in that prices adjust slowly to changes in supply and demand (unlike commodities like corn or wheat). Although prices do decline, it’s the decline in volume that leads to declining employment in real estate related occupations like construction, RE sales, mortgages, and more, and impacts the general economy.


