by Calculated Risk on 4/04/2005 06:07:00 PM
Monday, April 04, 2005
The Worsening General Fund Deficit
Here is the current Year over Year deficit number (April 1, 2004 to April 1, 2005). As of April 1, 2005 our National Debt is:
$7,783,719,222,961.24 (that is almost $7.8 Trillion)
As of April 1, 2004, our National Debt was:
$7,122,841,728,666.17
So the General Fund has run a deficit of $660.9 Billion over the last 12 months. SOURCE: US Treasury
 Click on graph for larger image.
For comparison:
For Fiscal 2004 (End Sept 30, 2004): $596 Billion
For Jan 1, 2004 to Jan 1, 2005: $609.8 Billion
For Feb 1, 2004 to Feb 1, 2005: $618.6 Billion
For Mar 1, 2004 to Mar 1, 2005: $635.9 Billion
It just keeps getting worse.
NOTE: I use the increase in National Debt as a substitute for the General Fund deficit. For technical reasons this is not exact, but it is close. Besides I think this is a solid measure of our indebtedness; it is how much we owe!
NAR: Pending Home Sales Index
by Calculated Risk on 4/04/2005 03:32:00 PM
The National Association of Realtors (NAR) has introduced a "Pending Home Sales Index".
Here is their first news release "Pending Home Sales Index Rises".
"The Pending Home Sales Index,* based on data collected for February, stands at 123.2, which was 2.2 percent above January and 10.4 percent above February 2004. The index is based on pending sales of existing homes, including single-family and condo. A home sale is pending when the contract has been signed but the transaction has not closed. Pending sales typically close within one or two months of signing.
David Lereah, NAR’s chief economist, said sales are looking strong for March and April. “Although home sales eased in February, housing activity appears to be firming with a modest uptrend in the months ahead,” he said. Data for March existing-home sales will be released April 25.
An index of 100 is equal to the average level of contract activity during 2001, the first year to be analyzed. Coincidentally, 2001 was the first of four consecutive record years for existing-home sales. 2001 sales are fairly close to the higher level of home sales expected in the coming decade relative to the norms experienced in the mid-1990s. As such, an index of 100 coincides with a historically high level of home sales activity."
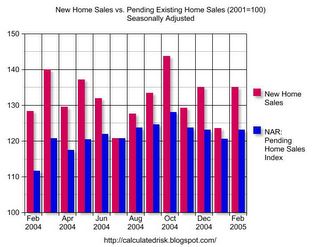
Click on graph for larger image.
This graph compares New Home Sales vs. the new Pending Home Sales Index (2001 = 100 for both series - all data seasonally adjusted). Sources: NAR and Census Bureau.
Previously I have ignored Existing Home Sales since it lagged New Home Sales by a couple of months. Maybe this new index will be more useful.
More on Housing Speculation
by Calculated Risk on 4/04/2005 02:49:00 AM
My most recent post is up on Angry Bear.
Housing: Speculation is the Key
Although my post on Angry Bear is about speculation and the housing bubble, I am mostly concerned with the impact of a housing slowdown on the general economy. Here is my thinking process:
1) Is there a bubble? Yes.
2) If there is a bubble, how widespread?
3) How and when will it end?
4) What will be the impact on the general economy (and the trade deficit, and interest rates)? Click on Graph for larger image.
This graph is part of the answer to "how widespread?" The graph shows home appreciation, in both nominal and real terms, over the last 5 years by region (and the US total). In some of the Central areas, there has been very little appreciation, but I would still be interested in leveraged financing and Mortgage Equity Withdrawal numbers in those areas.
Best Regards to All!
Housing: Speculation is the Key
by Calculated Risk on 4/04/2005 02:21:00 AM
I have taken to calling the housing market a "bubble". But how do I define a bubble?
A bubble requires both overvaluation based on fundamentals and speculation. It is natural to focus on an asset’s fundamental value, but the real key for detecting a bubble is speculation - the topic of this post. Speculation tends to chase appreciating assets, and then speculation begets more speculation, until finally, for some reason that will become obvious to all in hindsight, the "bubble" bursts.
Speculation is the key.
A recent report by the National Association of Realtors (NAR) reported that 23% of all homes nationwide were bought by investors. Another 13% of homes were purchased as second homes. In Miami, it was reported that 85% of "all condominium sales in the downtown Miami market are accounted for by investors and speculators". This is clear evidence of speculation.
The following supply demand diagrams illustrate this type of speculation.
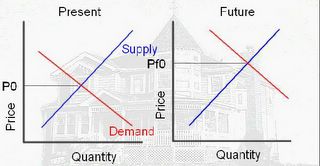 Click on diagram for larger image.
The above diagram shows the motive for the speculator. If he buys today, at price P0, he believes he can sell in the future at price Pf0 (price future zero), because of higher future demand. The speculation would return: Profit = Pf0-P0-storage costs (the storage costs are mortgage, property tax, maintenance, and other expenses minus any rents).
In this model, speculation is viewed as storage; it removes the asset from the supply. The following diagram shows the impact on price due to the speculation:
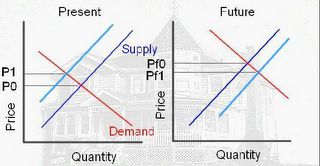 Since speculation removes the asset from the supply, the Present supply curve shifts to the left (light blue) and the price increases from P0 to P1. In the second diagram, when the speculator sells, the supply increases (shifts to the right). The future price will fall from PF0 to PF1. As long as (PF1 – storage costs) is greater than P1 the speculator makes a profit.
However, if the price does not rise, the speculator must either hold onto the asset or sell for a loss. If the speculator chooses to sell, this will add to the supply and put additional downward pressure on the price.
This type of speculation appears to be rampant only in certain regions, mostly the coastal areas. However, something akin to speculation is more widespread – homeowners using substantial leverage with escalating financing such as ARMs or interest only loans.
Leverage as Speculation.
In this LA Times article "They're In — but Not Home Free", the writer describes a woman that is "able to afford, barely, her first home". She has taken out "an adjustable-rate mortgage that won't require her to pay any principal for three years". She is already strapped, working overtime to pay her bills, and doesn’t know what she will do in three years. She is a gambling that either her income will increase or that the value of her home will rise enough to sell at a profit.
Californians are adopting a "buy now, pay later" strategy on a massive scale. The boom in interest-only loans — nearly half the state's home buyers used them last year, up from virtually none in 2001— is the engine behind California's surging home prices.See article for graphic on “Risky Debt”. Here is a similar article in the Sunday Washington Post, "Homeowners in Harm's Way" and a summary of financing options from the WSJ Online: "Buy Now, Pay Later"
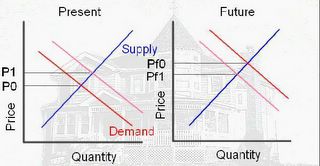
This type of leveraged activity pulls demand from future periods. Starting with the first diagram above, these leveraged financing programs shift the demand curve to the right (light red) and increase the price from P0 to P1. In the future, the demand will be shifted to the left and the future price will be Pf1. If Pf1 is less than P1 (the LA Times buyer's price), then her house might be foreclosed, increasing the supply too!
 One way to prolong the bubble is to offer ever more leveraged financing. And here it is - a 35 year loan, interest only for the first 5 years, with no money down and 103% Loan To Value (to cover closing costs). Amazing.
How many people are on the ragged edge? From the LA Times article:
The number of buyers falling into this category in any given month is unclear. But a California home builder recently got a sense when he sought to answer this question: How many of the potential buyers of his houses could still afford them if interest rates went up even a little?Only one in six buyers qualified for a slightly higher financing package. I believe that means we are close to the end of the housing cycle. Both types of activities are increasing prices: speculation is reducing supply and leverage is increasing demand.
To find out, the builder conducted a little experiment.
His firm's preferred lender had pre-qualified 90 potential buyers for a group of new houses. Since the houses wouldn't be ready for another six months, the builder tightened the loan criteria. He didn't want buyers to sign up for a house and then get frightened into canceling by rising rates.
He raised the threshold from a fully variable loan, the easiest to get since it immediately moves upward when rates increase, to a mortgage that was fixed for the first three years. That would shield buyers from rate jumps for at least a little while, but it's also more expensive.
Under the higher threshold, only about 15 of the buyers still qualified.
The Bust
Housing "bubbles" typically do not "pop", rather prices deflate slowly in real terms, over several years. Historically real estate prices display strong persistence and are sticky downward. Sellers tend to want a price close to recent sales in their neighborhood, and buyers, sensing prices are declining, will wait for even lower prices.
This means real estate markets do not clear immediately, and what we usually observe is a drop in transaction volumes. That is my expectation for this year: stable prices (maybe declining slightly on the coasts) and declining volumes. Stable or lower prices will halt speculation and increase the supply. And if rates rise further, or lenders become more discerning, demand will also decrease. Either spells bust for the current bubble.
Originally posted on Angry Bear.
Saturday, April 02, 2005
The Young Americans’ Employment Opportunity Act of 2005
by Calculated Risk on 4/02/2005 08:22:00 PM
Build your own Bush Administration. The guidelines are in this very funny post. A sample:
Change the terminology of the debate. Of course you can’t come right out and say, “Today I am calling for a repeal of the laws banning child labor.” Instead, give your approach a user-friendly, euphemistic title. Words to use include “America” (or “Americans”), “Opportunity,” “Freedom,” “Patriot,” “Tax-reduction,” etc. With the right words, a bill repealing child labor laws can easily become “The Young Americans’ Employment Opportunity Act of 2005.”Enjoy!
Thursday, March 31, 2005
Mortgage Rates Continue Climb
by Calculated Risk on 3/31/2005 11:07:00 PM
According to the FreddieMac weekly survey, 30 year fixed rate mortgages averaged 6.04% last week with 0.7 points. Also:
"Five-Year Treasury-indexed hybrid adjustable-rate mortgages (ARMs) averaged 5.43 percent this week, with an average 0.7 points, up from 5.35 last week. There is no annual historical information for last year since Freddie Mac only began tracking this mortgage rate at the start of this year.I would like to point out some quotes from this article "Higher rates dampen home ownership dreams in Bay Area" (hat tip to Ben at thehousingbubble for pointing this out):
One-year Treasury-indexed adjustable-rate mortgages (ARMs) averaged 4.33 percent this week, with an average 0.8 point, up from last week when it averaged 4.24 percent. At this time last year, the one-year ARM averaged 3.46 percent."
In the first two months of 2005, 82 percent of people who bought homes in the nine Bay Area counties and Santa Cruz County got adjustable-rate mortgages, according to DataQuick Information Systems. But buyers who chose a one-year adjustable last year could be facing payment shocks when their loans adjust for the first time this year, [Greg McBride, a senior financial analyst at Bankrate.com] said.First, it is important to note that 82% of buyers in the Bay Area used ARMs! So this is a relevant calculation.
Last spring, a buyer with a $450,000 loan at 3.47 percent had a monthly payment of $2,013.17. This year, with the increase capped at a typical two percentage points, the rate would be 5.47 percent, and the monthly payment would be $2,531.76.
"And you're not done," McBride said, "because this time next year it's likely to adjust again."
Next, we could do a similar calculation with the current rate. An ARM based on the one year treasury is 4.33% (the one year last week was yielding 3.4%). If someone took out a $450,000 loan this week, their monthly payment would be: $2234.86. If the loan increased the maximum, their payments next year would be $2794.18. Ouch!
But there is another interesting calculation. I've seen several analysts arguing that home prices are fundamentally correct assuming buyers only consider their monthly payment when purchasing a house (as opposed to other fundamentals, like replacement cost or buy vs. rent). If we assume $50K down and a $450K loan, a house that was worth $500K last year should only be worth $455K this year - a 9% price decline.
Of course prices of homes in the Bay Area have increased 12% (according to OFHEO) in the San Francisco, San Mateo, and Redwood area last year. Based on this "payment" approach to value, if homes were fairly valued last year, they are now overvalued by about 20%.
Buying GDP Growth with Debt
by Calculated Risk on 3/31/2005 12:43:00 AM
The final fourth quarter GDP numbers were released by the Commerce Department. The headline number was 3.8% annualized GDP growth in the 4th quarter of 2004. That is solid growth and about average for the last 10 years.
However, the growth in the National Debt and household mortgage debt in the 4th quarter, as a percentage of GDP, is the untold story. Here are the numbers for the 4th quarter, 2004:
GDP: $2.999 Trillion ($11.994 Trillion annual rate)
Increase in National Debt: $217 Billion (US Treasury)
Increase in Mortgage Debt: $205 Billion (Federal Reserve: Flow of Funds)
The increase in National and household mortgage debt as % of GDP: 14.1%
This continues a trend over the last four years as depicted in this chart. It appears that we are buying GDP growth with debt. If I was analyzing a company's balance sheet, and I saw this trend, I would be very concerned.
And the 4th quarter was even worse. The increase in debt was 14.1% of GDP.
With all that additional debt, maybe we should be asking why GDP growth was so low!
Wednesday, March 30, 2005
The Thirty Year Hamburger
by Calculated Risk on 3/30/2005 04:29:00 PM
Mortgage defaults are on the rise in Denver. This story says that "soaring foreclosure filings in Arapahoe County for the first three months of this year helped drive metro Denver's foreclosure rate 34 percent higher than the same period of last year and 30 percent higher than the fourth quarter of 2004."
Some interesting quotes:
"Lenders started giving money to people, and it's gotten out of hand," said Jeannie Reeser, public trustee of Adams County. "I am talking to people who have jobs, but their income doesn't come anywhere close to matching their financing."But this post is about hamburgers. And not just any hamburgers; 30 year hamburgers! At the end of the Post article was this comment:
"I am not in a position to say it's faulty lending, but we have too many foreclosures that are on brand-new loans not to conclude that something is wrong," [ said Arapahoe County Public Trustee Mary Wenke].
"Credit is so loose today that I can buy the groceries I need on a credit card, eat the food tonight, discard the food by tomorrow at noon and finance my debt on a 30-year, amortized loan. How stupid is that? But people do it all the time - and then they wonder why they're in foreclosure."The recipe for a 30 year hamburger:
1) Go to your fast food restaurant.
2) Buy a hamburger on your credit card.
3) Refinance your house and payoff your credit debt with a 30-year loan.
I hope it was a great hamburger!
Monday, March 28, 2005
AEI: Greenspan's Second Bubble
by Calculated Risk on 3/28/2005 11:10:00 PM
Even the conservative think tank, American Enterprise Institute, is opining about the housing bubble. AEI Economist John Makin both excuses and blames Greenspan for the bubble.
"Like so many difficult issues, the housing bubble has emerged from an unusual combination of events. The Fed’s response to each is defensible. However, taken collectively, those responses have encouraged what is arguably a worldwide housing bubble."Very interesting.
Recession Predictions: A Mug's Game?
by Calculated Risk on 3/28/2005 11:59:00 AM
"It's hard to make predictions - especially about the future."
Allan Lamport, former Toronto Mayor.
UPDATE: Two people have commented that the above quote was from Yogi Berra. It definitely sounds like Berra, and it is usually attributed to Berra, but I'm pretty sure it is from Mayor Lamport.
I’m going to take a look at the last consumer recession (July 1990 to March 1991) for clues about what to look for in the current situation. I believe the next recession will be consumer driven, led by a slow down in real estate, perhaps triggered by high energy prices and rising interest rates.
First, I would like to point out that forecasters have a terrible record at predicting downturns. Victor Zarnowitz wrote that major "...failures of forecasting are related to the incidence of slowdowns and contractions in general economic activity. Forecasts...go seriously wrong when such setbacks occur." The reason for this predictive failure is primarily due to the forecasters' incentives. Zarnowitz wrote: "predicting a general downturn is always unpopular and predicting it prematurely—ahead of others—may prove quite costly to the forecaster and his customers".
Incentives motivate economic forecasters to always be optimistic about the future (just like stock analysts). Luckily I have no customers (my thoughts are free and worth every penny), no financial incentives and no reputation! That said, I’m not predicting a recession (yet), only suggesting tools that might help identify the next recession.
The 1990/1991 Recession
As we look back at the ’90 recession, here are a few quotes from Fed Chairman Alan Greenspan (bear in mind that the recession started in July, 1990):
“In the very near term there’s little evidence that I can see to suggest the economy is tilting over [into recession].” Greenspan, July 1990
“...those who argue that we are already in a recession I think are reasonably certain to be wrong.” Greenspan, August 1990
“... the economy has not yet slipped into recession.” Greenspan, October 1990Source (pdf): "Booms, Busts, and the Role of the Federal Reserve" by David Altig (See macroblog)

A common belief is that the stock market predicts economic activity. Looking back at 1990, here is a graph of the S&P 500. The graph shows that the market rallied right into the recession and only started selling off after the recession started.
Click on graph for larger image.
Another coincident indicator in 1990 was employment.

This graph shows monthly job creation in 1990. Although job creation was spotty for a couple of months before the recession, it didn’t turn negative until after the recession started.
A potentially predictive tool, often cited by investors, is an inverted yield curve. An inverted yield curve exists when the rates on shorter duration instruments are higher than rates on longer duration instruments. Here are the yields for the 13 week treasury note, and 5 year and 10 year treasury bills.

The curve inverted in mid-1989, a full year before the recession started. A popular joke on Wall Street at the time was that the yield curve has predicted eleven of the last 7 recessions! The yield between the 5 year and 10 year did stay narrow right up to the recession. I'm not sure why the bond market would have more information than the stock market, but this indicator is frequently cited.
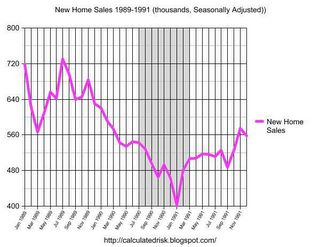
The last chart is my favorite leading indicator: New Home Sales. As the chart indicates, New Home Sales were declining for 12 months prior to the start of the recession. This has been observed (usually 8 to 12 months) for other consumer recessions (see New Home Sales as Leading Indicator and Update).
It makes sense that consumers, sensing economic weakness, would pull back on large purchases first (like homes). Then, since the Real Estate market is a large percentage of the U.S. economy, a slow down in Real Estate acts as a drag on the general economy - perhaps a self-fulfilling prophecy.
The Current Situation
So what does this mean for today?

First, here is the current chart for the 13 week treasury note, and 5 year and 10 year treasury bills. Clearly interest rates are rising, but the chart also shows that the yield curve is narrowing. The spread between the five and down year bills is close to 30 bps.

And finally, here is the current chart for New Home Sales. It is possible that New Home Sales peaked last October, however February's data was still very strong.
So, for now, I do not believe a recession is imminent. I'm just starting to watch for the early signs. Predicting recessions may be a mug's game, but I'm probably going to play.


