by Calculated Risk on 4/20/2005 01:22:00 AM
Wednesday, April 20, 2005
Bruce Bartlett Whispers the "R" Word
Bartlett believes that talk of a recession is "premature", but he expresses his general concerns that "the financial sector of the economy is under growing strain that could burst and spill over into the real economy suddenly and without warning."
He concludes:
... there are the dreaded “twin deficits” looming over financial markets. Huge budget and current account deficits mean that vast amounts of capital flows are necessary to keep them funded. So far, this has gone well, but that is largely because the Chinese have been so accommodating about financing them—effectively financing their own exports by buying large quantities of U.S. Treasury securities with their export earnings.My question: Great skill? By whom? Is there anyone in the Administration even thinking about these issues?
But now the U.S. is strongly pressuring China to stop doing this in order to allow its currency to rise against the dollar. It is hoped that this will reduce China’s production advantage in dollar terms and bring down the bilateral trade deficit. However, the cost to the U.S. economy if this happens could be greater than the potential gain. At least in the short run, any scale-back in China’s buying of Treasury securities might cause interest rates to spike very quickly. This could prick the housing bubble and bring down home prices, eroding personal wealth and putting a squeeze on those with floating rate mortgages.
Hopefully, this can all be managed smoothly and without either a recession or a market break. But it will take great skill and a lot of luck to avoid both.
UPDATE: pgl and William Polley add some comments. Make sure to read the comments in response to pgl's post.
Tuesday, April 19, 2005
Housing Starts
by Calculated Risk on 4/19/2005 06:29:00 PM
Angry Bear and Macroblog have commented on housing starts being lower than expected. Usually sales are a better indicator than starts, so look for the New Home Sales announcement next week.
This was an interesting comment buried in the story:
One concern among builders, [Dave Seiders, chief economist with the National Association of Home Builders] said, is that speculators are buying in new housing developments, which drives demand in the short term but could show up as excess supply down the road. "If the investor community should get worried, we could have a wholesale tumbling."I believe speculation is the key to any bubble. This post on Angry Bear discussed the storage aspect of speculation - the "excess supply down the road" that Mr. Seiders is discussing. From the Angry Bear post:

Click on diagram for larger image.
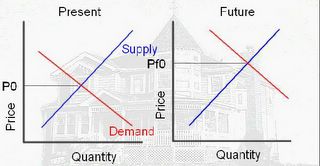
This diagram shows the motive for the speculator. If he buys today, at price P0, he believes he can sell in the future at price Pf0 (price future zero), because of higher future demand. The speculation would return: Profit = Pf0-P0-storage costs (the storage costs are mortgage, property tax, maintenance, and other expenses minus any rents).
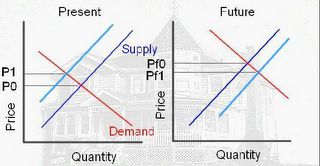
In this model, speculation is viewed as storage; it removes the asset from the supply. The following diagram shows the impact on price due to the speculation:

Since speculation removes the asset from the supply, the Present supply curve shifts to the left (light blue) and the price increases from P0 to P1. In the second diagram, when the speculator sells, the supply increases (shifts to the right). The future price will fall from PF0 to PF1. As long as (PF1 – storage costs) is greater than P1 the speculator makes a profit.
However, if the price does not rise, the speculator must either hold onto the asset or sell for a loss. If the speculator chooses to sell, this will add to the supply and put additional downward pressure on the price.
There is more in the Angry Bear post including a discussion of leverage as speculation.
I know I repeat myself sometimes - an old habit - sometimes I think certain ideas are worth revisiting. Best Regards to All.
Monday, April 18, 2005
Inflation Preview
by Calculated Risk on 4/18/2005 04:15:00 PM
UPDATE: Macroblog has a nice review of today's numbers. Look to Angry Bear tomorrow after the CPI is released.
The BLS reports PPI tomorrow and CPI on Wednesday. Over the last year, both the CORE PPI and CPI, less Food and Energy, have been steadily increasing on a year over year basis.
Click on graph for larger image.
Also plotted is the intended FED Funds Rate. A neutral Fed Funds rate would probably be about 150 to 200 basis points above CPI less food and energy. The Fed funds rate is currently at 2.75% with core inflation running about 2.5% to 3%.
The Fed Funds rate is still very accommodative unless the FED expects future inflation rates to fall. Dr. Krugman suggested that we may be seeing "A Whiff of Stagflation"; a slowing economy with rising inflation.
UPDATE: I probably should have include the FED's favorite measure of inflation, the PCE deflator (around 1.6%). The PCE is also steadily increasing and still puts the neutral rate around 3.25% to 3.5%.
The PPI and CPI numbers deserve close scrutiny this week.
Bubble Employment
by Calculated Risk on 4/18/2005 11:12:00 AM
Here are a couple of charts on real estate related employment. 
Click on graph for larger image.
This graph is from The Big Picture.
For RE agents, California alone has added 113,307 licensed RE agents since July 2000. The total RE agents in California (427,389) represents 1.9% of the total working population of California. Many of these agents only work part-time, but that is still a substantial loss of income if RE volumes drop 30 to 40% - like a typical RE slowdown.
Thanks to ild and Elroy for the second chart.
Just like RE agents, there has been a significant increase in mortgage brokers. There has been a similar increase in residential building trades, appraisers, home inspectors and other housing related occupations. The impact of a housing slowdown on employment will be significant.
Sunday, April 17, 2005
More on Housing
by Calculated Risk on 4/17/2005 11:22:00 PM
My most recent post, Housing: After the Boom, is up on Angry Bear.
I know some people don't think there is a bubble. For those people I recommend: "In Real Estate Fever, More Signs of Sickness". Also my post on Speculation might be useful - if you don't mind a few Supply-Demand charts.
For me the more interesting topic is what happens AFTER the boom. This not only has implications for housing, but for the general US economy and the World economy.
A couple of references:
Please see Patrick's blog for a nice list of recent articles on housing.
And Ben's site, appropriately named "The Housing Bubble" has daily analysis of, what else, the housing bubble!
UPDATE: Here is another nice housing bubble blog.
Saturday, April 16, 2005
John Snow: Misinformed or Mendacious?
by Calculated Risk on 4/16/2005 10:25:00 PM
US Treasury Secretary John Snow made the following comments at the G7 meeting in Washington regarding the US budget deficit:
-Snow said the US is strongly committed to cutting its budget deficit.
The White House motto apparently is: "Promise Prudence, Deliver Squander". Actions speak louder than words, and there are no actions that indicate the Bush Administration is committed to cutting the budget deficit. After four years of progressively worse deficits, only a fool would take their word. And next year's budget promises more of the same (see Another Budget, Another Disaster).
-[John Snow] said the budget deficit is expected to be 3.5 pct of GDP this year which is 'still too large', but the Bush administration's plans mean that the deficit should be cut to well under 2 pct of GDP by 2009.
This statement is simply untrue. The budget deficit will be close to $650 Billion this year or about 5.5% of GDP. Mr. Snow is using the Enron style "unified budget" that includes the Social Security surplus to offset Bush's deficit. A close approximation to the General Fund deficit is the annual increase in the National Debt. Anyone can check the increase in the debt by checking the US Treasury site.
As of April 14, 2005 the National Debt is $7.79 Trillion. At the start of the current fiscal year (Sept 30, 2004) the National Debt was $7.38 Trillion. That is a 6 1/2 month deficit of $408 Billion (close to 6% of GDP) and there are still 5 1/2 months remaining in the fiscal year.
There are no public plans to cut the deficit to under 2% of GDP by 2009. If they have a secret plan, they should tell the American people. More likely the deficit will be over 7% of GDP in 2009.
-'Deficits matter, they are unwelcome, and must come down,' [John Snow] said.
Tell that to Vice President Dick Cheney who, according to former Treasury Secretary Paul O'Neill, said "Reagan proved deficits don't matter." Since the Bush Administration's actions mirror Cheney's alleged comments, why should we believe Mr. Snow?
Is John Snow mendacious or just misinformed? Either choice is troubling.
G7 Preview: Oil, Renminbi and more
by Calculated Risk on 4/16/2005 01:58:00 AM
With global imbalances becoming more serious, the G7 will meet in Washington this weekend. Unfortunately, once again the US seems out of step with the rest of the World.
While the US is calling for "immediate flexibility on renminbi", Japan is saying the G7 will not press China for flexibility.
And US Treasury Secretary John Snow is calling for reforms in Europe and Japan saying: "They [Europe and Japan] clearly need to grow faster. They need to get rid of impediments and obstacles to growth in those economies. They have to grow faster. That is absolutely certain and that will be my principle message to my G7 colleagues."
But Jeroen Kremers, the Dutch IMF director stated: “Global external imbalances are caused by the US and Asia, not by Europe. Involving Europe in the call for action to correct external imbalances confuses the issue and has provided an excuse for inaction in the US.”
Perhaps the only area of agreement is that oil prices are too high and that better transparency of oil stocks is needed. Of course the Europeans think the US encourages waste with low taxes on oil. And the US thinks European taxes are too high.
And finally, I believe any discussion of global imbalances needs to start with the burgeoning US fiscal deficit, so it is no surprise that Mr. Snow has rarely mentioned it. To say the least, I'm not sanguine.
Friday, April 15, 2005
Housing: New Records in California
by Calculated Risk on 4/15/2005 01:57:00 AM
Both Northern and Southern California are reporting record sales for March according to DataQuick. Highlights for Northern California, Record Prices, Near-Record Sales:
Home prices in the Bay Area rose to new highs in March as sales for that month were at their highest level in sixteen years.
Prices are going up at their fastest pace in four years.
The typical monthly mortgage payment that Bay Area buyers committed themselves to paying was $2,566 in March, an all-time high. A year ago it was $2,052.
Indicators of market distress are still largely absent.
And the highlights for Southern California, Records and Near-Records in SoCal:
home prices in Southern California hit a new peak last month
Sales were near record levels
The typical monthly mortgage payment that Southland buyers committed themselves to paying was $1,983 last month, up from $1,905 for the previous month, and up from $1,602 for March a year ago.
Indicators of market distress are still largely absent.
Everything looks great, and yet ...
Social Security: Krugman, Marshall and Tanner Debate Video
by Calculated Risk on 4/15/2005 12:18:00 AM
On March 15, Dr. Paul Krugman, Talking Points Josh Marshall and Cato's Michael Tanner debated Social Security at the New York Society for Ethical Culture. The video of the debate is now available.
VIDEO Parts One and Two.
UPDATE: pgl at Angry Bear has some interesting comments: Social Security: Tanner v. Krugman and Marshall
And since I mentioned Krugman, be sure to read his Friday Op-Ed: "The Medical Money Pit". This piece covers most of the same ground as Kash and AB over on Angry Bear. An excerpt:
The authors concluded that Americans spend far more on health care than their counterparts abroad - but they don't actually receive more care. The title of their article? "It's the Prices, Stupid."
Why is the price of U.S. health care so high? One answer is doctors' salaries: although average wages in France and the United States are similar, American doctors are paid much more than their French counterparts. Another answer is that America's health care system drives a poor bargain with the pharmaceutical industry.
Above all, a large part of America's health care spending goes into paperwork. A 2003 study in The New England Journal of Medicine estimated that administrative costs took 31 cents out of every dollar the United States spent on health care, compared with only 17 cents in Canada.
In my next column in this series, I'll explain why the most privatized health care system in the advanced world is also the most bloated and bureaucratic.
Thursday, April 14, 2005
IBM: More Evidence of a Global Slowdown
by Calculated Risk on 4/14/2005 07:25:00 PM
IBM reported that earnings would fall short of expectations: "IBM Misses Quarterly Earnings Forecast". Perhaps more important than the earnings announcement was this comments by IBM's Chairman and CEO Samuel J. Palmisano:
"After a strong start, we had difficulty closing transactions in the final weeks of the quarter, especially in countries with soft economic conditions, as well as with short-term Global Services signings,"This comment does not bode well for the US trade and current account deficits. The following graph shows the total US imports and exports since 1960.

Click on graph for larger image.
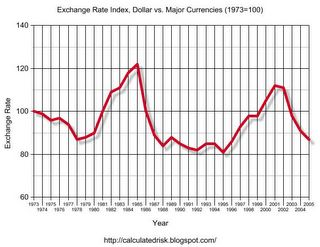
Imports have been rising fairly steadily since the early '70s. Exports have also been rising, but they have been more erratic. There have been two large declines in exports, the first in the early '80s and the other recently. Both declines were associated with a strong dollar as the next graphs indicate.

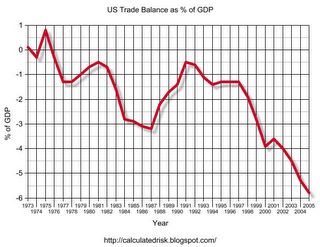
This graph shows the exchange rate since 1973 for the dollar against major currencies as calculated by the Federal Reserve. The second graph for the same time period shows the trade balance as a % of GDP.
NOTE: The 2005 trade deficit is estimated at $720 Billion with a 6% nominal increase in GDP.

The signing of the Plaza Accord in 1985 is very clear as the value of the dollar started to drop. The dollar stopped dropping in 1987 with the Louvre Accord. The weaker dollar clearly led to an increase in American exports.
With the recent dramatic drop in the value of the dollar, many people are hoping that the US exports will start to increase again in relation to imports. But with overseas economies faltering and the US economy still strong, US exports will probably continue to decline in relation to imports.
An improvement in the trade balance requires either overseas economies to strengthen or a slowdown / recession in the US.


