by Calculated Risk on 5/09/2005 09:36:00 PM
Monday, May 09, 2005
Update on UK Housing
Forbes reported today that UK housing prices are up " 0.31 pct from the previous quarter". That is a slight decline in real terms. However the "volume of sales decreased by 34.77 pct". That is exactly how a housing bust usually works:
"Housing "bubbles" typically do not "pop”, rather prices tend to deflate slowly in real terms, over several years. Historically real estate prices display strong persistence and are sticky downward. Sellers want a price close to recent sales in their neighborhood, and buyers, sensing prices are declining, will wait for even lower prices. This means real estate markets do not clear immediately, and what we usually observe is a drop in transaction volumes."It is the drop in transaction volumes that causes general economic problems (slower retail sales, lower employment, etc.).
UPDATE: In the comments, David Bennett recommends General Glut's comments. Globblog is an excellent site!
See this morning's post on Angry Bear concerning UK housing: When will Housing Slowdown?
March Trade Deficit (Due Wednesday)
by Calculated Risk on 5/09/2005 02:50:00 PM
The current projection for the March trade deficit is $61.2 Billion (briefing.com) to $61.7 Billion (NYTimes). My feeling is this projection is on the low side.
In the comments to a previous post, Brad Setser excerpted some of Morgan's view ($61.2 Billion forecast) on oil:
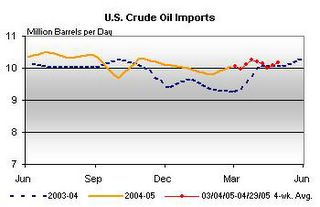
On the imports side, a sharp rise in oil prices should more than offset some moderation in volumes and lead to another sizable increase in petroleum products.First, according to the Census Bureau, the contract price for imported crude in Feb was $36.85. According to the DOE, the contract price for Mar was close to $46. Also there was no "moderation in volumes" according to the DOE:

Click on graph for larger image.
Source: Dept of Energy
The cost for imported energy related petroleum products was $14.9 Billion in February. The cost for imported petroleum in March will be approximately $20 Billion.
The uncertainty in this report is from the impact of slowing US demand in March (the "soft patch") and the impact of the slowing economies in Europe. (See Ken's comments too) Trade with China is the largest contributor to the trade deficit, and it appears that China's economy was still going strong in March (about 25% of the total goods deficit in February was to China).
Finally, Morgan concludes with:
"Note that our forecast trade deficit is about the same as the Bureau of Economic Analysisassumed in preparing the advance estimate of Q1 GDP."If Morgan is underestimating the trade deficit, then there will also be a significant reduction in Q1 GDP.
Sunday, May 08, 2005
More on housing and the UK
by Calculated Risk on 5/08/2005 11:49:00 PM
My most recent post is up at Angry Bear: When will Housing Slowdown?
There is more bad news from the UK and I think the UK might be leading the US by 6 to 8 months with a housing slowdown.
UPDATE: U.K. Manufacturing Output Slumps
U.K. manufacturing had its biggest drop in almost three years in March, pushing industry closer to recession and damping expectations of higher interest rates after the Bank of England left its benchmark rate unchanged today.
Factory production, which accounts for 16 percent of the economy, dropped 1.6 percent from February, the National Statistics office said in London today. The median forecast in a Bloomberg survey of 26 economists was for a 0.1 percent increase.
The decline in manufacturing comes on top of signs of a slowdown in consumer spending in the U.K.'s 1.1 trillion-pound ($2.1 trillion) economy.
Best to all.
Friday, May 06, 2005
Not Seasonally Adjusted Non-Farm Payroll
by Calculated Risk on 5/06/2005 07:16:00 PM
In the previous post I cautioned about the difference between seasonally adjusted data and not seasonally adjusted data. The reason was some commentators were misusing the birth / death model that is not seasonally adjusted.
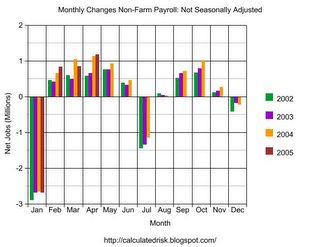
Click on graph for larger image.
This illustrates why the BLS reports seasonally adjust job growth. There is a very distinct pattern to hiring / firing. As an example, every January all of the temporary retail help is let go.
For the current month, 1.179 million new "not seaonally adjusted" jobs were created according to the payroll report. The BLS reported 274 thousand new jobs. They seasonally adjust each category, so it is very difficult to determine the actual factors.
For those that want to check these numbers, go here. Just check the boxes for both "Not seasonally adjusted" and "Seasonally Adjusted" Total nonfarm employment. Then click on Retrieve Data.
Two charts will appear. For seasonally adjusted: If you subtract the March number from April you will get the headline number of 274K. For not seasonally adjusted: If you do the same subtraction (March from April) you will get the 1.179 Million number.
CAUTION: Don't use the "Not Seasonally Adjusted" for anything except these exercises. Take a look at January - we lost 2.692 Million jobs! (but seasonally adjusted we gained 124K). We lose a ton of jobs every January and July for seasonal reasons ... this is a series that really needs seasonal adjustment.
The BLS Employment Birth / Death Model
by Calculated Risk on 5/06/2005 12:10:00 PM
In some net discussions, there appears to be some confusion over a component of the jobs report. Today's very good report had a headline number of 274 thousand jobs created in April.
Several places on the internet have pointed out that the birth / death model added 257 thousand jobs to the payroll report. Then they argue that 257K of the 274K were from estimated jobs created by new business. This is incorrect and is a lesson in mixing seasonally adjusted numbers with "not seasonally" adjusted numbers.
The headline seasonally adjusted number for April is 274K jobs. The not seasonally adjusted birth /death model (jobs generated by new business formations) was 257K.
The actual BLS reported jobs created in April was 1.179 Million (before seasonal adjustment). Of these 1.179 million jobs, 257K came from the birth/death model (or about 22%).
If you follow the link to the birth/death model you will see:
"Note that the the net birth/death figures are not seasonally adjusted, and are applied to not seasonally adjusted monthly employment links to determine the final estimate."Finally, when the 1.179 Million jobs is seasonally adjusted you get 274 Thousand headline number.
Also note the BLS caveat:
"The most significant potential drawback to this or any model-based approach is that time series modeling assumes a predictable continuation of historical patterns and relationships and therefore is likely to have some difficulty producing reliable estimates at economic turning points or during periods when there are sudden changes in trend. BLS will continue researching alternative model-based techniques for the net birth/death component; it is likely to remain as the most problematic part of the estimation process."
Thursday, May 05, 2005
Buffett and FDR
by Calculated Risk on 5/05/2005 02:11:00 AM
Warren Buffett was on CNN's Lou Dobbs Tonight on Wednesday. Here is an excerpt:
DOBBS: Are you surprised when you focus on the two deficits we just talked about, the trade deficit, and the budget deficit? The budget deficit is 3.6 percent of our GDP. The trade deficit is reaching just almost 6 percent of GDP. And the president is talking about reforming Social Security. Does that surprise you?There is no question that the Bush Administration is ignoring the most serious economic problems facing America and that they are more interested in ideological driven issues. The most serious fiscal issues are: the General Fund deficit, the current account / trade deficit, and health care. Why are we talking about Social Security?
BUFFETT: Well, it's an interesting idea that a deficit of $100 billion a year, something, 20 years out, seems to terrify the administration. But the $400 plus billion dollars deficit currently does nothing but draw yawns. I mean the idea that this terrible specter looms over us 20 years out which is a small fraction of the deficit we happily run now seems kind of interesting to me.
 I'm reminded of this letter that FDR wrote in 1924 to Delaware attorney Willard Saulsbury.
"I remarked to a number of friends that I did not think the nation would elect a Democrat again until the Republicans had led us into a serious period of depression and unemployment", FDR, Dec 9, 1924
Buffett might find the denial of our serious problems "interesting", but I'm worried that FDR's prediction might ring true again.
I hope not. I remain an optimist; I believe if we acknowledge our problems and address them in a rational manner, we can fix them.
But all I see from the Bush Administration is denial and wishful thinking.
Wednesday, May 04, 2005
Slight Deficit Improvement
by Calculated Risk on 5/04/2005 11:48:00 PM
Here is the current Year over Year deficit number (May 1, 2004 to May 1, 2005 - closest non-weekend dates used). As of May 2, 2005 our National Debt is:
$7,754,579,738,148.68 (Almost $7.8 Trillion)
As of May 3, 2004, our National Debt was:
$7,105,796,969,042.55
So the General Fund has run a deficit of $648.8 Billion over the last 12 months. SOURCE: US Treasury
Of course the Washington Post exaggerates the improvement "Tax Receipts Exceed Treasury Predictions." First, they report the Enron style budget ... , uh, Unified budget. Second, they are wrong about the size of the improvement in the deficit. They are correct when they report that "... the positive turn is likely to be short-lived".
Click on graph for larger image.
For comparison:
For Fiscal 2004 (End Sept 30, 2004): $596 Billion
For Jan 1, 2004 to Jan 1, 2005: $609.8 Billion
For Feb 1, 2004 to Feb 1, 2005: $618.6 Billion
For Mar 1, 2004 to Mar 1, 2005: $635.9 Billion
For Apr 1, 2004 to Apr 1, 2005: $660.9 Billion
For May 1, 2004 to May 1, 2005: $648.8 Billion
A slight improvement.
NOTE: I use the increase in National Debt as a substitute for the General Fund deficit. For technical reasons this is not exact, but it is close. Besides I think this is a solid measure of our indebtedness; it is how much we owe!
BBC: Britain braced for credit crunch
by Calculated Risk on 5/04/2005 09:51:00 PM
Is this the future for the US? A housing slowdown with declining consumer spending. And now the BBC reports that Britain is bracing for rising foreclosures and bankruptcies:
"Not since the mid-1990s, as the last economic recession claimed its final victims, has so much debt pain been felt by so many people.
Debt charities and credit industry bodies have told BBC News that they have seen a surge in the numbers of people unable to pay their bills.
At the same time, according to official figures nearly 26,000 property repossession orders were granted in the first three months of 2005, the highest number since 1995.
And on Friday, it is widely expected that the Department for Trade and Industry (DTI) will reveal a sharp rise in the number of people going bankrupt.
In short, the UK's trillion pound debt hangover finally seems to be kicking in."
Senatorial Sciolism
by Calculated Risk on 5/04/2005 12:39:00 AM
Ignorance is curable. It just takes experience and education. But what can we do when the Chairman of the Senate Budget Committee ignorantly proclaims that "we are tackling the problem of federal spending"? Laugh? Cry?
Today Senator Judd Gregg (R-NH) made that outrageous and specious claim. In a commentary in the New Hampshire Union Leader, Gregg claimed "For the first time in nearly a decade, the budget forces meaningful savings in mandatory government programs, which are driving out-of-control, long-term deficits."
Nonsense. What is driving out-of-control structural deficits is the significant drop-off in tax revenue from the Bush tax shifts.
UPDATE: Correct Y axis on Graph.
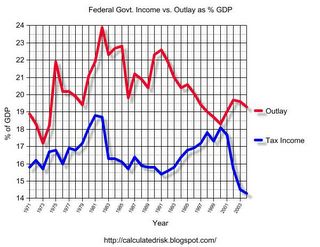
Click on graph for larger image.
The chart depicts Federal Government income and outlays as a % of GDP. "Income" does not include the surpluses for the various trust funds. A steady combination of spending restraint and tax increases brought the budget into balance at the end of the ‘90s. The primary cause of the current budget deficits is the significant decrease in tax revenues, as a % of GDP, due to the Bush tax shifts.
Gregg seems to believe that the fiscal 2006 budget will reduce the deficit. That is also not true. The $106 billion in additional tax cuts for high income earners exceeded the cuts in programs for the poor, meaning the fiscal 2006 budget deficit will set another dubious record.
Mr. Gregg continues: "First, we must tackle the short-term deficit, ..." Although Gregg predictably misunderstands the causes of the deficits, I agree the short term deficit is the top fiscal issue facing America. Not Social Security. But this budget does nothing about the deficit ...
And finally Gregg wrote:
[The budget] maintains job-creating tax policy that has resulted in the fastest-growing economy since 1999 ...
Absolute nonsense. The tax policy was not targeted at job creation. In fact, despite Gregg's implication, this recovery has seen the weakest job creation of any recovery since the Great Depression.
If Gregg was a writer for NRO, I would just chuckle. But he is the Chairman of the Senate Budget Committee. Ignorance and power are a poor combination.
Tuesday, May 03, 2005
More from the UK
by Calculated Risk on 5/03/2005 10:29:00 PM
Independent: ... but in Britain, retailers see worst slide in sales for nearly 13 years
Scotsman: Double hit hints at rates cut
Scotsman: What slowdown means: now's the time to get real
And a harsh review of Greespan's tenure - Jeremy Warner's Outlook: As the world economy falters, Greenspan, the grand illusionist, faces his Waterloo
"Fast forward 20 years and how will historians come to judge Alan Greenspan, chairman of the Federal Reserve? As things stand, Mr Greenspan's report card reads "outstanding performance so far, but jury still out on the final verdict".
...
Just to put this in perspective, even with the Fed funds rate now at 3 per cent it is still "only" 2 per centage points higher than a year ago. By historic standards, rates remain incredibly low. Yet even at this level of interest rates, with inflationary pressures apparently building, US growth continues to look fragile. It's going to be hard to raise rates much further without sending the economy into a tailspin.
Back in Britain, we are seeing something of the same phenomenon. Interest rates remain low by historic standards, but the economy seems extraordinarily sensitive to anything higher. Just six months ago, everyone was talking about the return of inflation. Now the City wonders whether we have not already reached the peak of the interest rate cycle. Retail is suffering some of its worst trading conditions in years and manufacturing seems to be slipping back into recession.
With Mr Greenspan, the question is whether he can ever now hope to wean the US off its addiction to low interest rates ... continued growth has been achieved only at the cost of mountainous current account and budget deficits and an ever growing housing market bubble.
As he tightens once more, Mr Greenspan again finds the economy beginning to suffer. The magic is beginning to wear thin, and, like an illusionist whose sleight of hand is uncovered, scepticism is now palpable: Mr Greenspan may have succeeded only in delaying the pain, not in removing it.
...
Can Mr Greenspan succeed in engineering a soft landing for the US economy, where there is gradual correction of the present imbalances, or has he lost control of the aircraft as it careers towards the runway? The judgement of history awaits."


