by Calculated Risk on 12/01/2005 09:03:00 PM
Thursday, December 01, 2005
Housing: Remarks by Controller of the Currency
John C. Dugan, Controller of the Currency, remarked today on exotic mortgages and the housing market. The first half of his talk, before the Consumer Federation of America, concerned changes to credit card regulations. Here are his remarks (pdf) on negative amortization mortgage products:
"And so, just as we come to the end of the neg am story in credit card lending, I fear we are at the beginning of one in the mass marketing of home mortgages. One of the new “non-traditional” mortgage products you may have heard about is the so-called payment-option ARM – a mortgage that allows borrowers to select from a menu of payment possibilities, ranging from a fully amortizing monthly payment to the neg am payment option that does not cover the outstanding interest. Such products have been available for quite a long time, but until recently had been provided primarily to a narrow group of very creditworthy borrowers who found differing payment options to be an attractive “cash management” tool over time. In this niche market – which is different from the credit card market because of the collateral securing the loan – borrowers have generally had the wherewithal and sophistication to handle temporary periods of negative amortization without jeopardizing their ultimate repayment of principal.
In the last two years, however, we have seen a spike in the volume of payment-option ARMs, which are no longer largely confined to well-heeled borrowers who can clearly afford them. Increasingly, they are being mass marketed as “affordability products” to borrowers who appear to be counting on the fixed period of exceptionally low minimum payments – typically lasting the first five years of the loan – as the primary way to afford the large mortgages necessary to buy homes in many housing markets across the country. And as the loans become more popular, the prospect of using them to penetrate the subprime lending market cannot be far behind.
The fundamental problem with payment option ARMs, other than the growing principal balance due to negative amortization, is payment shock. A traditional 30-year fixed-rate mortgage requires the borrower to amortize the principal balance through equal payments over the 30-year life of the loan. In contrast, a typical payment-option ARM is a 30-year mortgage that permits five years of negative amortization by allowing a borrower to make very low minimum monthly payments during that period. Beginning in the sixth year, the borrower must begin paying the full amount of interest accruing each month, and must also begin amortizing the increased principal over the remaining 25-year life of the loan. The combination of these factors can produce sharply increased payments in year six. For example, a typical payment-option mortgage of $360,000 at 6 percent can produce a monthly payment increase of nearly 50 percent in that year, assuming no change in interest rates. If rates rise to just 8 percent, the payment increase when amortization begins would nearly double.
To the extent that they are planning for such contingencies, many payment-option-ARM borrowers calculate that they will be able to sell their property or refinance the mortgage by year six. But if real estate prices decline – and there already is evidence of softening in some markets – these borrowers could face the bleak prospect of loan balances that exceed the value of the underlying properties. In that case, selling the property or refinancing the loan would not be a viable escape valve for avoiding huge payment shocks.
In these circumstances, do consumers really understand the potential consequences of the neg am feature inherent in a payment-option ARM? Is this an appropriate product to mass market to customers who may be looking at the less than fully amortizing minimum payment as the only way to afford a larger mortgage – at least for the five years before the onset of payment shock? And are lenders really prepared to deal with the consequences – including litigation risk – of providing such products in markets where real estate prices soften or decline, or where interest rates substantially increase?
I fear the answer to all these questions may be “no.” That is one reason why, if all goes according to plan, the Federal banking agencies will propose new guidance with respect to nontraditional mortgage products by the end of this month. While the guidance will cover many other issues besides negative amortization and payment option ARMs, these will certainly be central among the topics addressed. I am mindful of the history of neg am products in credit cards, and I recognize that the nationwide mass marketing of neg am mortgages is in its infancy. As a result, I firmly believe that the guidance should draw clear lines about appropriate standards for qualifying borrowers for payment option ARMs that explicitly take into account potential payment shock. Put another way, lenders should not encourage or accept applications from borrowers who clearly cannot afford the dramatically increased payments that are likely to result at the end of the five-year, low minimum payment period. Disclosures should also be clear, timely, and meaningful. And lenders should have very substantial controls in place to manage the potential risk of such loans."
Quarterly House Appreciation by State
by Calculated Risk on 12/01/2005 03:04:00 PM
In addition to YoY appreciation rates, the OFHEO HPI also presents the quarterly appreciation by state. Every state had positive price increases for Q3 2005.
The worst performing states in Q3 were Michigan (0.89% quarterly increase, 3.6% annual rate) and Kansas (0.94% quarterly increase, 3.8% annual rate).
The best was Arizona (7.3% quarterly increase or a 32.6% annual rate). The following map shows the state by state quarterly appreciation:
Quarterly Appreciation:
Red: Greater than 5%
Dark Orange: 4% to 5%
Light Orange: 3% to 4%
Purple: 2% to 3%
Light Blue: 1% to 2%
Dark Blue: less than 1%
Its important to note these are quarterly rates.
Florida, the DC area and the West Coast continue to see the most price appreciation. Massachusetts has cooled substantially as inventories have increased, although prices still appreciated 1.4% for Q3 (or 5.7% annual rate).
House Price Index Shows 12 Percent Annual Increase
by Calculated Risk on 12/01/2005 10:19:00 AM
The Office of Federal Housing Enterprise Oversight (OFHEO) released (pdf) their Q3 House Price Index this morning.
UPDATE: See Kash's Post: House Prices. Kash breaks the numbers down by some of the hotter markets.
Average U.S. home prices increased 12.02 percent year over year from the third quarter of 2004 through the third quarter of 2005. This represents a two ercentage point decline from the previous four-quarter appreciation rate of approximately 14 percent. Appreciation for the most recent quarter was 2.86 percent. The figures were released today by OFHEO Acting Director Stephen A. Blumenthal, as part of the House Price Index (HPI), a quarterly report analyzing housing price appreciation trends.
“Appreciation rates in the third quarter were extremely strong, although some deceleration can be seen in a number of the faster-appreciating markets,” said OFHEO Chief Economist Patrick Lawler. “Price momentum in the Pacific and New England states, in particular, has pulled back.”
House prices grew more rapidly over the last year than did prices of non-housing goods and services reflected in the Consumer Price Index. House prices rose 12 percent, while prices of other goods and services rose only 4.5 percent.
Appreciation rates in the Pacific Census Division fell from last quarter, but remain higher than in other areas. At slightly less than 16.9 percent, the four-quarter appreciation rate in the South Atlantic Division now trails appreciation in the Pacific by less than one-half a percentage point.
Other significant findings in the HPI:
1. Price growth in Arizona continues to accelerate, with a one-year appreciation rate of 30 percent, the largest of any state by a wide margin.
2. Florida became the second fastest-appreciating state, with four-quarter appreciation of 25 percent and 11 of the 20 highest ranked Metropolitan Statistical Areas (MSAs).
3. Nevada’s four-quarter appreciation rate declined by more than 10 percentage points from the previous rate of 28.6 to 17.6 percent.
4. Two states that continue to show noticeable house price appreciation are Idaho and Utah. Idaho, with an appreciation rate of 15.1 percent on a four-quarter basis, is now ranked 12 among states, up from 20 in the previous HPI report. With annual price growth of 11.4 percent, Utah’s ranking jumped to 22, compared with 31 in the previous HPI report and last place in the fourth quarter of 2003.
5. With a four-quarter appreciation rate of 34.4 percent, Phoenix-Mesa-Scottsdale, AZ topped the list of the fastest appreciating MSAs for the first time since OFHEO began publishing its index in the fourth quarter of 1995. Last quarter’s top MSA, Naples-Marco Island, FL, dropped to number three.
6. For the first time since the fourth quarter of 2003, the list of the Top 20 MSAs having the highest appreciation does not contain any Nevada cities. Reno-Sparks, NV, the fourth ranked market last quarter is now 29 among the 265 ranked MSAs. Also, Las Vegas - Paradise, NV has fallen from 21 to 77, with four-quarter appreciation of 13.77 percent.
“Much of the recent run-up in mortgage rates occurred after the third quarter ended,” said Lawler. “To the extent that those increases may have affected prices, those effects will be evident in future quarters.”
Changes in the mix of data from refinancings and house purchase transactions can affect HPI results. This HPI report includes an index that is calculated using only purchase price data. The index shows an increase of 10.95 percent for the U.S. between the third quarter of 2004 and the third quarter of 2005.
Wednesday, November 30, 2005
The Indefatigable Consumer
by Calculated Risk on 11/30/2005 08:14:00 PM
Should the American consumer be labeled 'indefatigable' or 'incorrigible'? One thing is certain, the consumer crossed the savings Rubicon in the summer of 2005.
First, a warm welcome back to General Glut: How we achieved 4.3%! This graph from Professor Hamilton, from July, shows the declining savings rate over the last 20 years. See Dr. Hamilton's post: Which came first: the savings chicken or the deficit egg?
As Gen'l Glut points out, personal saving as a percentage of disposable personal income reached -1.5% in Q3 2005. So imagine the line on Dr. Hamilton's graph continuing its descent into negative territory.
The Rubicon has been crossed.
MBA: Refinance Applications Down Again
by Calculated Risk on 11/30/2005 11:14:00 AM
The Mortgage Bankers Association (MBA) reports: Mortgage Application Volume Dips During Holiday Shortened Week
The Market Composite Index — a measure of mortgage loan application volume – was 624.1 a decrease of 1.8 percent on a seasonally adjusted basis from 635.4, one week earlier. On an unadjusted basis, the Index decreased 33.2 percent compared with the previous week but was down 8.0 percent compared with the same week one year earlier. The seasonally-adjusted indexes include an additional adjustment to account for the Thanksgiving holiday.
The seasonally-adjusted Purchase Index increased by 0.8 percent to 476.2 from 472.3 the previous week whereas the Refinance Index decreased by 6.3 percent to 1484.3 from 1584.1 one week earlier.
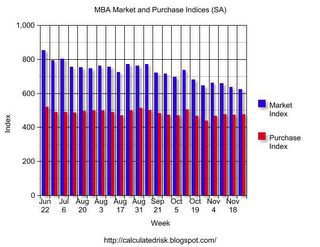
Click on graph for larger image.
The graph shows overall and purchase activity since June. Overall activity has fallen significantly due to the drop in refis. Purchase activity is steady.
As expected, mortgage rates declined again last week:
The average contract interest rate for 30-year fixed-rate mortgages decreased to 6.20 percent from 6.26 percent on week earlier...Mortgage rates will probably increase this week. Overall this report shows purchase activity is steady at a very high level, but refinance activity continues to decline significantly. It is possible that MEW (Mortgage Equity Withdrawal) is falling rapidly, and this would be expected to impact consumer spending - maybe early next year.
The average contract interest rate for 15-year fixed-rate mortgages decreased to 5.72 percent from 5.83 percent...
See: Real-Estate Boom Soon May Sputter As an Engine of Retail Sales
Tuesday, November 29, 2005
Record October New Home Sales: 1.424 Million
by Calculated Risk on 11/29/2005 10:10:00 AM
According to the Census Bureau report, New Home Sales in October were at a seasonally adjusted annual rate of 1.424 million vs. market expectations of 1.20 million. September sales were revised up to 1.260 million from 1.222 million.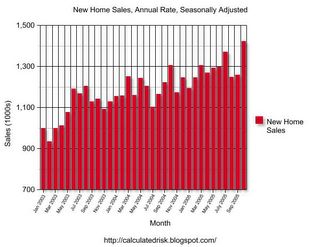
Click on Graph for larger image.
NOTE: The graph starts at 700 thousand units per month to better show monthly variation.
Sales of new one-family houses in October 2005 were at a seasonally adjusted annual rate of 1,424,000, according to estimates released jointly today by the U.S. Census Bureau and the Department of Housing and Urban Development.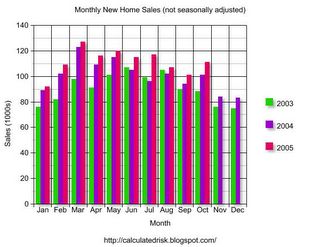
The Not Seasonally Adjusted monthly rate was 111,000 New Homes sold, up from a revised 101,000 in September.
On a year over year basis, October 2005 sales were 10% higher than October 2004.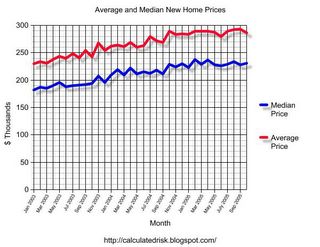
The median sales price was stable and previous months were revised upwards.
The median sales price of new houses sold in October 2005 was $231,300; the average sales price was $286,500.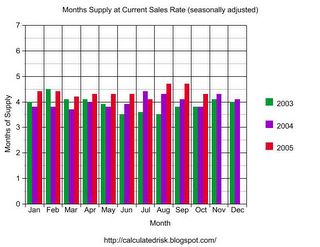
The seasonally adjusted estimate of new houses for sale at the end of October was 496,000. This represents a supply of 4.3 months at the current sales rate.
The 496,000 units of inventory is the all time record for new houses for sale. On a months of supply basis, inventory is at a reasonable level.
This is a very strong report. The pronouncements of the demise of the housing market now appear premature.
Monday, November 28, 2005
Second Homes
by Calculated Risk on 11/28/2005 05:44:00 PM
Here are two commentaries on second homes ...
Dr. Robert Shiller writes: Home sweet second home
...the world is undergoing a second-home boom: an increasing number of people are buying vacation homes in beautiful and fun places that are within a few hours’ flying time from their first homes and jobs. Their second homes are a retreat where they will spend only a fraction of the year, and recently pristine mountain ridges and ocean cliffs are being dotted with new homes to meet the demand.Fannie Mae Economist David Berson asks: What would the housing market have looked like if investor and second home demand had been more normal?
...
Some of the US counties with a high proportion of vacation homes are seeing price increases that rival, if not outstrip, the booming metropolitan areas.
...
There is reason to worry about this. ... in some places, a speculative bubble is fueling today’s boom in vacation-home prices. The vacation-home boom appears psychologically tied to the urban home-price bubble in many of the world’s “glamour cities,” and prices of these vacation homes are similarly vulnerable to a significant drop in coming years.
Data from Loan Performance indicate that the share of purchase originations going to investor and second home buyers has been trending upward for the past decade or so, with a significant acceleration beginning in 2003 -- although the modest decline in the investor share in the most recent quarter may be a sign that this trend is beginning to end (see Figure 1). The low share of investor/second home activity in the early-mid 1990s, however, was likely a reaction to the drop in home prices over that period, and so was below sustainable levels. Moreover, demographics suggest that second home demand should be rising, given the large share of the population between 45-60 years of age -- the prime second home buying years. As a result, an investor/second home share of 10-13 percent might be sustainable -- not the more than 20 percent current share. The lower end of this range represents the investor/second home share in 2002 (just before the recent boom began), while the upper end represents a continuation of the longer-term 1997-2002 trend.
Figure 2 shows our estimate of total home sales if the investor/second home share had either remained at the 2002 level of 10 percent, or had increased more modestly to 13 percent by the middle of 2005 -- compared with actual sales. Over the two-and-a-half year period from the beginning of 2003, total home sales would have been 17.9 million units instead of the actual sales of 19.3 million units over that period if the investor/second home share had stayed flat at 10 percent (a drop of 7.3 percent, or 1.4 million fewer units). Using the assumption that the investor/second home share would have increased to 13 percent by the middle of 2005, total sales would have been 18.2 million units (a drop of 5.7 percent, or 1.1 million fewer units).
In either scenario, home sales would have been considerably less than the actual figure since 2003 if the investor/second home share hadn’t skyrocketed in the past couple of years. Next week’s commentary will look at what the future path for home sales could be if the investor/second home share returns to a more normal level over the next year.
Existing Homes: Sales Fall, Inventory Increases
by Calculated Risk on 11/28/2005 10:04:00 AM
A few comments for October:
Existing Home Sales fell 2.7% to 7.09 million annual rate.
Inventories increased 3.5% to 2.87 million. This represents 4.9 months of supply. Although inventories are at record levels, the months of supply is still within the normal range because of the strong sales activity.
Inventories are up 16.3% since last October.
Both median and average prices were solid and rebounded from last month. The median prices was $218K, up from $213K in September and just below the record set in August of $220K.
The average price $267K, up from $261K, and just below the August record of $269K. Prices are not seasonally adjusted and it is normal for prices to fall a little from the summer peak.
The AP reports: Existing Home Sales Decline in October
"This signals that the housing sector has likely passed its peak. The boom is winding down to an expansion," said David Lereah, chief economist for the Realtors.Mortgage rates have fallen for two consecutive weeks and might fall further this week. For an interesting discussion on the flattening yield curve, see Dr. Hamilton's: Inverted yield curve edges closer
...
Lereah predicted that housing activity would cool further in coming months if, as expected, the Federal Reserve keeps pushing interest rates higher to combat rising inflation pressures that have been triggered by a surge in energy prices.
Those price increases have contributed to a rise in mortgage rates although rates retreated a bit last week to 6.28 percent from 6.37 percent the previous week, which had been the highest level in two years.
"We feel confident that housing is landing softly as rates continue to rise," Lereah said.
Some economists had expressed fears that rising mortgage rates could burst the housing bubble much as a speculative bubble in Internet stock prices burst in early 2000, sending shockwaves throughout the economy.
Politics: Steve Young for Congress
by Calculated Risk on 11/28/2005 01:17:00 AM
Those of us living in California's 48th Congressional District are suffering election fatigue. Our Representative, Christopher Cox, is the new SEC Chairman and his congressional seat is vacant.
We will now be voting in our third election in just over two months: October 4th was the district primary and November 8th was the California statewide special election. The General Election is Dec 6th.
Steve Young for Congress
The 48th District has historically voted Republican and will likely go to Republican John Campbell. But Democrat Steve Young has a chance. Young has an excellent organization and it is possible that the GOP vote will be split between Campbell and Minuteman founder Jim Gilchrist.
I've spoken with the Campbell campaign. They told me he is fiscally responsible and strongly supports President Bush's economic policies. When I started laughing at the contradiction, they knew they had lost my vote.
I believe Steve Young offers a reasonable alternative for change.
A friend of mine attended the Steve Young pancake breakfast this morning and emailed this summary:
My wife and I attended this morning's pancake breakfast for Steve Young. The turnout was good and supportive of what he is trying to do. There were several speakers that offered their support. Tom Umberg, Frank Barbaro and Pat Kelly were enthusiastic about Young's chances provided that the Democrats come out and vote. Kelly, who is Secretary Treasurer of Teamsters Union local 952 indicated that a strong effort is needed to have Democrats from all over the nation come to the support of Young. A victory in this traditional Republican area would do a lot to energize the Democratic party.The campaign needs money and volunteers to make phone calls to get out the vote: (949) 640-4400
...
Again it was stressed that the turnout for this election will be very small. With Gilchrist expected to garner some of the votes that would go to Campbell a significant vote of registered Democratic voters will make Young a winner.
...
PS - the pancakes were good.
P.S. This will be an interesting week for housing data. Both New and Existing home sales will be reported this week and the Q3 OFHEO House Price Index will be released Dec 1st.
Sunday, November 27, 2005
Housing: Exotic Loans, Regulation and Foreclosures
by Calculated Risk on 11/27/2005 01:40:00 PM
These three articles seem to go together ...
The AP reports: Mortgage packages head into iffy stage
With the housing market cooling and loan demand shrinking, banks and other lenders are turning to nontraditional and sometimes riskier mortgages to bring in more business and make up their lost revenue.The Philadelphia Inquirer reports: New rules coming on 'exotic' mortgages
...
Many lenders have turned to mortgage products designed to lower monthly loan payments and to help borrowers qualify more readily for larger loan amounts, while others require little in the way of documentation during the approval process. These loans do make it easier for some people to get mortgages, but they also can raise the possibility that some borrowers may end up in default.
In the first six months of the year, demand for alternative adjustable-rate mortgages, also known as Alt-A or option ARMs, and interest-only mortgages increased as the difference in interest rates for standard ARMs and fixed-rate mortgages narrowed, said Doug Duncan, chief economist for the Mortgage Bankers Association of America in Washington.And the North County Times (San Diego) reports: As housing price increases slow, more mortgages going into default
The share of first-mortgage originations that were interest-only loans rose to 23 percent from 17 percent during the same period last year, and the Alt-A share increased to 11 percent from 8 percent.
...
"The markets with a high percentage of these loans are more fragile to shocks such as rising interest rates," [National Association of Realtors' chief economist David] Lereah said last month during the Realtors' convention in San Francisco.
Lereah went to the Office of the Comptroller of the Currency, which oversees the nation's banks, "to talk about the behavior of lenders who are offering these exotic mortgages."
"I'd like to see more guidelines on the percentage of these loans that can be issued, even if it slows home sales, to ensure a soft landing for the market," he said.
He found that he and the comptroller, John C. Dugan, were on the same page. New guidelines on nontraditional loans are due Jan. 1 ... (emphasis added)
Foreclosure activity has edged up in recent months, providing yet another small but clear sign of cooling in Riverside County's housing market. Banks and other lenders sent 1,266 notices of default to Riverside County borrowers in the third quarter, a move that gives homeowners 90 days to catch up on payments before moving towards an auction, according to La Jolla-based DataQuick Information Systems. That number is up from 1,121 in the second quarter and 1,116 notices in the third quarter of 2004.
The shift reflects a return toward historical averages and comes amid signs that Southwest County's real-estate party is winding down.
"Even now, the level of foreclosure activity is unnaturally low," DataQuick analyst John Karevoll said.
Homeowners, particularly first-time homebuyers in suburban markets such as Southwest County, always face a certain amount of financial distress, Karevoll said. That's particularly true now, with adjustable-rate mortgage payments rising faster than salaries. The median monthly payment in October was $2,169, up 20 percent from October 2004, according to DataQuick.


