by Calculated Risk on 12/13/2005 11:06:00 AM
Tuesday, December 13, 2005
NRF: Strong November Retail Sales Surpass Expectations
The National Retail Federation reports:
Consumers started their holiday shopping with a bang, responding well to retailers' aggressive promotions. According to the National Retail Federation (NRF), retail industry sales for November (which exclude automobiles, gas stations, and restaurants) rose a strong 7.4 percent unadjusted over last year and increased 0.5 percent seasonally adjusted from the previous month. The increase is in line with NRF's holiday sales forecast of 6.0 percent growth.
"Consumers shook off concerns about higher energy costs and responded well to the seasonal promotions," said NRF Chief Economist Rosalind Wells. "If November is any indication of what consumers are capable of, retailers can expect a very happy holiday season."
November retail sales released today by the U.S. Commerce Department show that total retail sales (which include non-general merchandise categories such as autos, gasoline stations and restaurants) rose 0.3 percent seasonally adjusted from November, and increased 6.3 percent unadjusted year-over-year. Gasoline sales, which NRF does not include in its calculation of retail industry sales, rose 17.0 percent unadjusted from last November.
The rosy report was boosted by strong year-to-year growth across nearly every retail industry category, including building material and garden equipment and supplies stores, which jumped a whopping 14.3 percent over last year. The main drivers for this holiday, apparel and electronics, also experienced solid growth. Sales at clothing and clothing accessories stores rose 7.6 percent year-over year and electronics and appliance stores jumped 7.4 percent from November 2004.
Additionally, strong year-over-year gains were seen at health and personal care stores (6.7%), general merchandise stores (7.1%), furniture and home furnishing stores (5.9%) and grocery stores (5.3%).
NRF expects retail industry sales to increase 5.6 percent this year over 2004. Holiday sales, which are defined as retail industry sales in the full months of November and December, are expected to rise 6.0 percent to $438.5 billion.
Monday, December 12, 2005
Household Debt Service and "Parabolic Debt"
by Calculated Risk on 12/12/2005 05:00:00 PM
Reuters quotes Prudent Bear fund manager David Tice expressing concern today that 'credit market debt as a percent of U.S. gross domestic product "has essentially gone parabolic"'.
I'm more concerned that Household Debt Service is at an all time high, even with low interest rates. See my Angry Bear post: FED: Household Debt Service Sets Record in Q3
First, here are some quotes from the Reuters article:
A possible hard landing for the U.S. housing market poses the risk of a secular bear market for equities, mutual fund manager David Tice said on Monday at the Reuters Investment Outlook 2006 Summit.
"The rollover in real estate could happen pretty quickly," said Tice, who runs the the Prudent Bear, a mutual fund which seeks to benefit from falling share prices.
The United States has leaned heavily on housing and related industries for economic growth in recent years.
That virtuous circle, fueled by rounds of cash-out mortgage refinancing that has propped up consumer spending, will give way in 2006 or 2007 to a vicious cycle that drags down corporate earnings and employment, he said.
...
"The excesses in mortgage finance are just astounding," he said at the summit, which is being held in New York this week.
...
Years of cheap credit provided by an accommodative Federal Reserve has made more difficult the task of running a bear fund and picking the right stocks to short, Tice said.
...
Tice said credit market debt as a percent of U.S. gross domestic product "has essentially gone parabolic," and policy-makers have seemed prepared to prevent recession at all costs.
"If you continue to goose the economy with more debt it's like keeping an eight-year-old on a sugar high," he said.

Click on graph for larger image.
Tice is referring to all debt, but it might be helpful to look at the fastest growing segment; mortgage debt. This graph shows the growth of mortgage debt as a % of GDP since 1999.
Although mortgage debt has grown substantially, both nominally and as a % of GDP, I wouldn't call it "essentially ... parabolic".
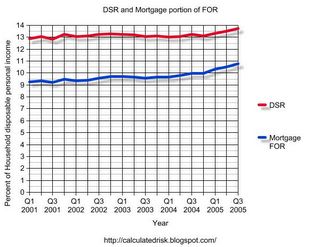
I think the greater concern is the recent rise in household debt service and financial obligations ratios. Both ratios are already at record levels.

DEFINITIONS: The household debt service ratio (DSR) is an estimate of the ratio of debt payments to disposable personal income. Debt payments consist of the estimated required payments on outstanding mortgage and consumer debt.
The financial obligations ratio (FOR) adds automobile lease payments, rental payments on tenant-occupied property, homeowners' insurance, and property tax payments to the debt service ratio.
Note: The graph only shows the mortgage portion of the FOR.
It appears households initially took on debt and kept their payments steady as interest rates dropped. However, recently the portion of disposable personal income dedicated to debt service has risen steadily. As interest rates rise, and with the new credit card minimum payments, the DSR and FOR will probably continue to rise, putting more pressure on household finances.
Saturday, December 10, 2005
GDP Growth: With and Without Mortgage Extraction
by Calculated Risk on 12/10/2005 12:39:00 AM
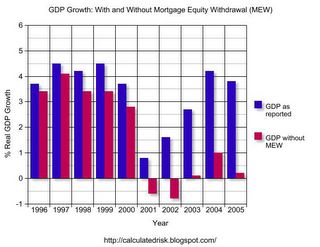
The recent Flow of Funds report showed that household mortgages increased a record $289.5 Billion in Q3 2005. Using a simple formulation for Mortgage Equity Withdrawal (MEW), MEW was $171 Billion in Q3. Note: to calculate MEW, I simply subtracted new single family construction spending from the increase in household mortgages. This is close to other methods.
Click on graph for larger image.
Using Goldman's estimate of about 2/3 of MEW flowing through to personal consumption expenditures, it is possible to estimate the impact of MEW on GDP. Note: Some estimates are only about 50% of MEW flows through to consumption.
The graph clearly shows the importance of MEW over the last few years. For 2005, I used YTD compared to 2004.
Many observers estimate that MEW will fall significantly in the next few years. If so, this will be a drag on GDP as the growth of personal consumption expenditures slows.
The two most direct impacts of a housing slowdown are:
1) the loss of housing related employment.
2) lower MEW and the impact on personal consumption expenditures.
Earlier I posted two articles on the loss of housing related employment:
LA Times: Mortgage Industry Job Losses May Rise With Interest Rates
CNN: There go 800,000 jobs out the door
A significant drop in MEW will lead to the loss of retail related employment too.
Friday, December 09, 2005
Minimum-Payment Loans Get Maximum Crackdown
by Calculated Risk on 12/09/2005 07:27:00 PM
The WaPo reports: Minimum-Payment Loans Get Maximum Crackdown
Federal financial regulators appear to be on the verge of reining in one of the most popular mortgages in hot housing markets nationwide -- loans that allow 1 percent to 2 percent payment rates leading to "negative amortization."The author is basing this article on John Dugan's remarks last week (Comptroller of the Currency).
UPDATE: I linked to the wrong speech ... here is the correct one:
For excerpts see: Remarks by John C. Dugan, Comptroller of the Currency
And here is the complete text of Dugan's remarks (pdf).
The bottom line for 2006: Look for tougher standards on popular 1 percent and 2 percent minimum-payment plans, and fewer qualified buyers in high-cost markets where wild appreciation has been sustained in part by reality-bending rate-reduction programs
Housing and Jobs
by Calculated Risk on 12/09/2005 03:18:00 PM
The LA Times reports: Mortgage Industry Job Losses May Rise With Interest Rates
As interest rates have risen, refinancings have faded and applications for loans to purchase homes have begun to decline, according to the Mortgage Bankers Assn.And the impact from these job losses could ripple through the economy:
Many borrowers already have taken out equity from their homes through refinancings and second mortgages. If home prices level off, as many predict, these homeowners will have less equity to extract and less incentive to refinance.
Mortgage Bankers Assn. economist Doug Duncan said jobs would be lost as some companies pared their staffs and others were acquired or went out of business. The number of job reductions will depend on how high rates go, he said, with as many as 80,000 positions eliminated should 30-year fixed rates climb to 8.25%, up from 6.32% currently.
In addition to layoffs, experts also expect a shakeout in the ranks of mortgage brokers, the independent loan originators whose numbers have swollen along with the home-lending boom that began in 2001.
These brokers aren't counted in the payroll surveys conducted by the government. John Marcell, president of the California Assn. of Mortgage Brokers, believes that they now total about 25,000 in the state, but predicts that's about to change radically as ill-trained brokers who got into the business during the boom now find it harder to make a living.
"I would say probably half of what's out there today could wash out," Marcell said.
By reducing spending power and demand for office space, the loss of mortgage jobs can cause ripple effects through local economies like Orange County's. Ryan Ratcliff, an economist for the Anderson Forecast at UCLA, said studies of the early 1990s recession showed that regions with large employment in the mortgage industry were hurt disproportionately in economic downturns.When I first started looking at the housing market, I wrote this on Angry Bear: After the Housing Boom: Impact on the Economy. So far employment and mortgage equity withdrawal are still solid, but those are areas to watch closely.
Best of Times II
by Calculated Risk on 12/09/2005 12:37:00 AM
For a related post, see Kash's: The Role of Spending Growth in the Deficit
Many people think of the "Baby Bust" as the period right after the "Baby Boom". The real Baby Bust happened from 1925 to 1939. See this animation:
This has important implications for policy. Those people born between 1925 and 1939 are now 66 to 80 years old - the peak years for receiving retirement benefits.
The Baby Boomers are 40 to 60 - their peak earning years.
So these are the Best of Times for fiscal policy: fewer than the normal percentage of the population are recipients of elderly social programs, and a larger than normal percentage are in their peak earning years.
Social Security should be running a large surplus, and it is!
Medicare should be running a large surplus, but it is only breaking even.
The Federal Government should be running a large surplus, but it is running a large deficit.
From the prespective of demographics, the US Government needs to address the General Fund deficit NOW. America also needs to reform the health care system. These are the two most pressing long term fiscal issues for America.
Thursday, December 08, 2005
Household Valuation Change: FED vs. OFHEO
by Calculated Risk on 12/08/2005 09:11:00 PM
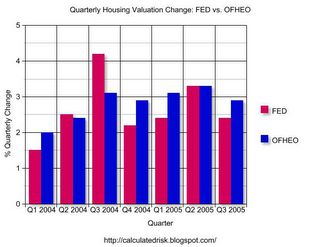
With the release of the Flow of Funds report today, I decided to compare the FED's estimate of the total value of household real estate with the OFHEO House Price Index (HPI). Of course OFHEO only reports the nominal change in house prices, so the comparison is really between the changes in valuation (either annually or quarterly).
I thought this might be interesting, mostly to see if there is a difference between the two approaches. The FED reports the total valuation of household real estate. This includes any new stock put into place and improvements to existing stock. OFHEO reports the change in the price of existing stock.
To compute the annual change for the FED for existing stock, I started with year N. For year N+1, I subtracted construction estimates from the Census Bureau of new private single family construction and improvements.
Click on graph for larger image.
The first graph shows the annual change from both the FED (subtracting new construction as above) and the OFHEO HPI. Clearly both methods yield similar results and I don't see any systemic bias either way.
The second graph is for the last seven quarters, and shows the quarterly change for both sets of data.
Once again both methods yield similar results with no discernible bias. This gives me a little more confidence in both data sets, unless the FED uses the OFHEO HPI as part of their calculation!
FED: Q3 Mortgage Debt increased at 14% Annual Rate
by Calculated Risk on 12/08/2005 12:16:00 PM
The FED Flow of Funds report was released today. It shows that household mortgage debt increased at a 14% annual rate in Q3, 2005.
On a dollar basis, household mortgage debt increased by an all time record $289.5 Billion in the 3rd quarter. The last 7 quarters (billions increase in household mortgages):
q1 2004: $190.4
q2 2004: $211.1
q3 2004: $277.1
q4 2004: $223.5
q1 2005: $176.5
q2 2005: $263.7
q3 2005: $289.5
The debt story continues.
Wednesday, December 07, 2005
MBA: Mortgage Application Volume Rebounds
by Calculated Risk on 12/07/2005 12:03:00 PM
Following the negative predictions from Dr. Leamer and the Anderson forecast, the MBA reports that mortgage applications rebounded and are still near record territory (seasonally adjusted).
UPDATE: Long term MBA graph courtesy of ILD:
Click HERE for larger image.
The Mortgage Bankers Association (MBA) reports: Mortgage Application Volume Rebounds
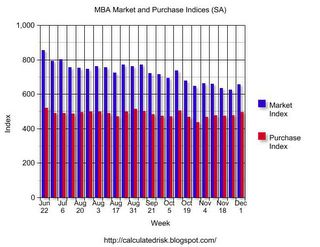
The Market Composite Index — a measure of mortgage loan application volume was 656.7 -- an increase of 5.2 percent on a seasonally adjusted basis from 624.1, one week earlier. On an unadjusted basis, the Index increased 46.8 percent compared with the previous week [Thanksgiving holiday] but was down 6.1 percent compared with the same week one year earlier.
The seasonally-adjusted Purchase Index increased by 4.0 percent to 495.1 from 476.2 the previous week whereas the Refinance Index increased by 7.0 percent to 1596.4 from 1484.3 one week earlier.

Click on graph for larger image.
The graph shows overall and purchase activity since June. Overall activity has fallen significantly due to the drop in refis. Purchase activity is steady.
Mortgage rates increased last week:
The average contract interest rate for 30-year fixed-rate mortgages increased to 6.32 percent from 6.20 percent on week earlier...Overall this report shows purchase activity is steady at a very high level.
The average contract interest rate for 15-year fixed-rate mortgages increased to 5.84 percent from 5.72 percent...
Dr. Leamer: Housing Slowdown May Claim 800,000 Jobs
by Calculated Risk on 12/07/2005 11:52:00 AM
From the AP: Housing Slowdown May Claim 800,000 Jobs
A sustained decline will hit the U.S. housing market next year, costing the nation as many as 800,000 jobs, according to a new economic report released Wednesday.
The slowdown is likely to last several years, with as many as 500,000 construction jobs and 300,000 financial sector positions lost, the quarterly Anderson Forecast predicted.
"We expect housing to start slowing the economy this quarter or the next," said Edward Leamer, director of the study done at the University of California, Los Angeles.
"Some jobs in manufacturing might well disappear as a result of weakness in housing, but this may be offset by jobs brought home or not lost to foreign competition," he wrote.
The forecast said eight of the last 10 economic recessions were started by housing market slowdowns. Though the coming cooldown will cause a drag on the nation's economy, it will fall short of triggering a recession, the forecast said.
The report cited several signs that the decline could be under way:
• New construction of housing in October was down 5.6 percent from the previous month, with new construction of single-family housing accounting for a 3.7 percent dip.
• New home sales have declined.
• Applications for home mortgages have trended downward since late September as rates increased.
• In some regions, homes are remaining unsold longer and the pace of housing construction is outpacing population growth, which could spell a decline in demand.
"On all these grounds, we believe housing is due for a sustained decline," economist Michael Bazdarich wrote in the forecast. "The remaining questions are how hard the fall will be and when it will begin."


