by Calculated Risk on 3/24/2006 02:34:00 PM
Friday, March 24, 2006
New Home Sales and Recessions: Part II
The following graph is an update to my previous post and includes the data for February. Its important to note that New Home Sales data can be heavily revised and February is just one data point.
Click on graph for larger image.
The white periods are recessions as defined by NBER. The New Home Sales economic indicator is now flashing yellow.
I'd be very concerned if New Home Sales fall below about 1.05 million units annual rate for several months.
February New Home Sales: 1.08 Million
by Calculated Risk on 3/24/2006 10:00:00 AM
According to the Census Bureau report, New Home Sales in February were at a seasonally adjusted annual rate of 1.08 million. January's sales were revised down slightly to 1.207 million.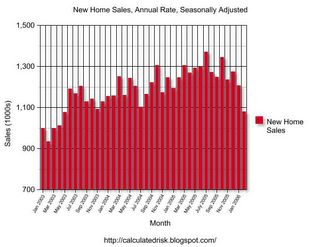
Click on Graph for larger image.
NOTE: The graph starts at 700 thousand units per month to better show monthly variation.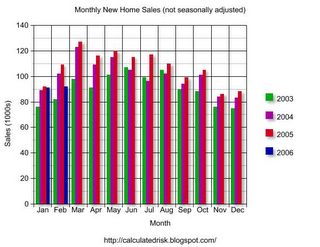
The Not Seasonally Adjusted monthly rate was 92,000 New Homes sold, slightly higher than the revised 91,000 in January.
On a year over year basis, February 2006 sales were 15.5% lower than February 2005.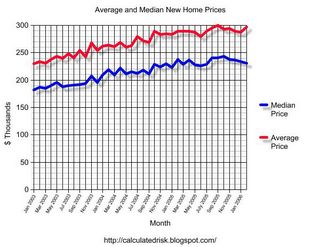
The median and average sales prices are steady.
The median sales price of new houses sold in February 2006 was $230,400; the average sales price was $296,700.
The seasonally adjusted estimate of new houses for sale at the end of February was 548,000. This represents a supply of 6.3 months at the current sales rate.
The 548,000 units of inventory is another all time record for new houses for sale. On a months of supply basis, inventory is significantly above the level of recent years.
This report is very weak, except for the median and average prices. One month does not make a trend, but New Home Sales have fallen in six of the last seven months.
Thursday, March 23, 2006
FDIC: Scenarios for the Next U.S. Recession
by Calculated Risk on 3/23/2006 09:37:00 PM
From the FDIC: Scenarios for the Next U.S. Recession. On housing:
The risk of a housing slowdown is another area of concern going forward. The recent housing boom has been unprecedented in modern U.S. history.2 It has been suggested by many analysts that the housing boom has been a significant contributor to gains in consumer spending in recent years. Indeed, a number of the FDIC roundtable panelists pointed to the apparent connection between rising real estate wealth during the past four years and the sustained strength in consumer spending during that period. Because consumer spending accounts for over two-thirds of U.S. economic activity, any shock to consumer spending, such as that which might be caused by a housing slowdown, is a concern to overall economic growth.Much more in article.
It is very likely that housing wealth has been a significant factor behind growth in consumer spending. Through the use of cash-out refinancing, increased mortgage balances, and greater use of home equity lines of credit, as well as through owners selling homes outright and cashing in on their accumulated equity, it is estimated that anywhere from $444 billion to $600 billion was liquidated from housing wealth during 2005.3 Whichever estimate one uses, the total almost surely eclipses the $375 billion gain in after-tax income for the year. While probably not all of the home equity liquidated during 2005 fed consumption spending (much of it was invested into other assets, including second or vacation homes), these statistics illustrate how important home equity has become as a source of household liquidity.
There are concerns, however, that changes in the structure of mortgage lending could pose new risks to housing. These changes are most evident in the rising popularity of interest-only and payment-option mortgages, which allow borrowers to afford more expensive homes relative to their income, but which also increase variability in borrower payments and loan balances. To the extent that some borrowers with these innovative mortgages may not fully understand the potential variability in their payments over time, the credit risk associated with these instruments could be difficult to evaluate. In addition, the degree of effective leverage in home-purchase loans has risen in recent years with the advent of so-called “piggy-back” mortgage structures that substitute a second-lien mortgage for some or all of the traditional down payment. Meredith Whitney noted at the roundtable that the recent use of revolving home equity lines of credit in lieu of down payments has enabled an increasing number of first-time buyers to qualify for homes that they otherwise could not afford. (Click here to link to the complete text of Ms. Whitney’s remarks in the transcript.)
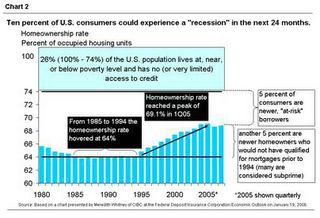
Overall, Ms. Whitney’s research suggests that a group that includes approximately 10 percent of U.S. households may be at heightened risk of credit problems in the current environment. This group mainly includes households that gained access to mortgage credit for the first time during the recent expansion of subprime and innovative mortgage loan programs. Not only do many borrowers in this group have pre-existing credit problems, they may also be more vulnerable than other groups to rising interest rates because of their reliance on interest-only and payment-option mortgages. These types of mortgages have the potential for significant payment shock that occurs when low introductory interest rates expire, when index rates rise, or when these loans eventually begin to require regular amortization of principal including any deferred interest that has accrued (see Chart 2).
Because of the importance of mortgage lending to bank and thrift earnings, the large-scale changes that have taken place in this sector will clearly have implications for the banking outlook. Bank exposure to mortgage and home equity lending is now at peak levels. As reported in the FDIC’s latest Quarterly Banking Profile (http://www2.fdic.gov/qbp/index.asp), 1-4 family residential mortgages and home equity lines of credit accounted for a combined 38 percent of total loans and leases in fourth quarter 2005, well above the roughly one-third share maintained at the beginning of the decade.
Housing analysts are in disagreement as to whether or not recent signs point to a moderation in housing activity or the beginning of a more significant correction. Currently, inventories of unsold homes and sales volumes are among the indicators pointing to a housing slowdown. Inventories of unsold existing homes rose from under four months of supply at current sales volume in early 2005 to 5.3 months of supply as of January 2006. Meanwhile, the pace of existing home sales has been trending lower since last summer. A clear trend in the direction of home sales and prices may not be evident until the completion of the peak spring and summer selling season later this year.
Many analysts argue that home prices in the hottest coastal markets, especially in the Northeast and California, could be poised to decline in the near future. For example, PMI Mortgage Insurance Company analysts place essentially even odds that home prices will decline during the next two years in a dozen cities in California and the Northeast.4 Should home prices either stop rising or begin to fall in these areas, local banks and thrifts would need to look to non-residential loans to support revenue growth.
Art McMahon of the OCC outlined the banking industry’s reliance on mortgage lending during his remarks at the FDIC roundtable. (Click here to link to the full text of Mr. McMahon’s remarks in the transcript.) Mr. McMahon acknowledged that previous historical episodes of large metro-area home price declines were generally the result of severe local economic distress.5 Should some regional housing market downturns occur, banks may be hard-pressed to generate non-residential loans in great volume. Historically, regional housing price declines have tended to be associated with a slowdown in small business activity, with banks making fewer commercial and industrial loans in addition to suffering mortgage and consumer portfolio stress.
Existing Home Sales
by Calculated Risk on 3/23/2006 10:05:00 AM
UPDATE: The National Association of Realtors (NAR) released their data for Existing Home Sales in February. NAR reported:
Existing-home rose in February following five months of decline, indicating a stabilization is taking place in the market, according to the National Association of Realtors®.Existing Home Sales are a trailing indicator. The sales are reported at close of escrow, so February sales reflect agreements reached in January. That is why weather in January is important.
Total existing-home sales – including single-family, townhomes, condominiums and co-ops – increased 5.2 percent to a seasonally adjusted annual rate1 of 6.91 million units in February from an upwardly revised pace of 6.57 million in January, but were 0.3 percent below a 6.93 million-unit level in February 2005.
David Lereah, NAR’s chief economist, said mild weather appears to be responsible for some of the gain. “Weather conditions across much of the country were unseasonably mild in January and likely were a factor in higher levels of buyer activity, which boosted sales that closed in February,” he said. “Higher interest rates had been tapping the breaks, notably in higher-cost housing markets since mortgage interest rates trended up last fall, but we’re seeing signs of stabilization in the market now with the sales rebound. Home sales should level-out in the months ahead.”
Also note that mortgage applications fell about 10% in February and March (compared to January). This probably indicates that existing home sales will fall in the coming months on a seasonally adjusted (SA) basis.
The MBA Purchase Index averaged 455 in December, 453 in January, 407 in February and 399 so far in March (all numbers SA).

Click on graph for larger image.
Existing Home inventories rose to over 3 million units in February. This is the start of the listing season, and I expect inventories to continue to rise. If sales fall about 10% (as indicated by the MBA purchase index) and the inventory continues to rise that could put the months of supply over 6 months.
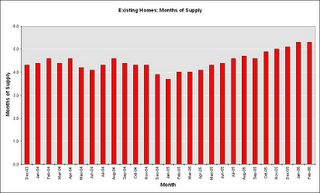
If sales fall about 10% (as indicated by the MBA purchase index) and inventories continues to rise at the current pace, the months of supply could be over 6 months by Summer. Usually 6 to 8 months of inventory starts causing pricing problem - and over 8 months a significant problem.
New Home sales (released tomorrow) is usually a better indicator of the housing market.
Wednesday, March 22, 2006
Fannie Mae on Housing
by Calculated Risk on 3/22/2006 12:02:00 PM
David W. Berson and Molly Boesel, Fannie Mae economists, write: Economic & Mortgage Market Developments. Here are some excerpts on housing:
Housing: Home sales continue to ebb, with even slower activity likely.And their predictions:
Both new and existing home sales continued their downtrend through January, despite warmer-thannormal weather that typically would have boosted sales. Local real estate groups in many housing markets are reporting additional sales declines, increases in unsold inventories, and even price drops. Moreover, leading indicators of home sales point to slower activity in coming months. Purchase applications data from the weekly Mortgage Bankers Association (MBA) survey fell in February to the lowest levels in two years, while the monthly builder survey from the National Association of Homebuilders (NAHB) was unchanged in February at the lowest level since 2002.
• New home sales fell by 5.0 percent to 1.23 million units (seasonally adjusted annual rate, or SAAR) in January, the lowest level in a year. Despite the ongoing decline in sales, actual sales in January were still up by 1.1 percent from a year ago.
• Total existing home sales (single-family plus condos/co-ops) fell by 2.8 percent to 6.56 million units (SAAR) in January. Actual sales in January were 2.9 percent less than a year ago.
• Helped by warm weather, total housing starts jumped by 14.5 percent to 2.28 million units (SAAR) in January. Both single-family and large (five or more units) multifamily starts rose, but there was a modest decline in starts for structures with two-to-four units.
• After surging to meet the needs of hurricane evacuees, manufactured housing shipments fell to 167 thousand units (SAAR) in January, the lowest level in four months.
Housing Outlook: Less investor activity and lower affordability will slow the pace of home sales in 2006, while home price gains slow sharply.
Although job/income growth and demographics are expected to remain positive for housing this year, the decline in affordability over the past couple of years (caused by surging home prices) and a sharp pull-back of investor demand should cause sales to fall. We project a decline of nearly 9 percent for total home sales in 2006 (somewhat less for new sales and starts, somewhat more for existing sales), bringing sales down to 7.61 million units. This would still be the third-strongest year on record for home sales.
Although we don’t expect much of a rise in 30-year FRM rates, ARM rates should continue to increase as the Fed tightens monetary policy. Housing affordability declined significantly over the course of 2005, and rising mortgage rates (along with even higher home prices in many areas) should push affordability down a bit more. More importantly, we expect investor demand for housing to fall sharply from the record share of 2005. Fortunately, continued job and income growth as the overall economy grows around trend rates will partially offset the big decline in housing activity that otherwise would occur. Moreover, the age-structure of the population and the surge in the number of immigrants over the past 25 years will continue to put upward pressure on owner-occupied housing demand. Taken together, these components of housing demand suggest the modest decline in our outlook, rather than something more severe.
This falloff in housing activity, and the resulting slower home price gains, won’t be uniform across the country. Those areas with the strongest regional economies should continue to see positive in-migration and housing demand. But, those areas that have had the strongest investor demand are at risk for sharp declines in housing demand – as well as the potential for significant increases in the supply of homes for sale. As a result, overall home price gains are projected to slow sharply in 2006 – down to only 2.5-3.0 percent after a couple of years of double-digit growth. And in those areas with the biggest falloff in investor demand (and the largest corresponding rise in inventories of homes for sale), there is a risk of home price declines – especially in those markets without strong job gains to help offset investor selling.
MBA: Mortgage Application Volume Down Slightly
by Calculated Risk on 3/22/2006 10:56:00 AM
The Mortgage Bankers Association (MBA) reports: Mortgage Application Volume Down Slightly

Click on graph for larger image.
The Market Composite Index — a measure of mortgage loan application volume was 565.0 – a decrease of 1.6 percent on a seasonally adjusted basis from 574.4 one week earlier. On an unadjusted basis, the Index decreased 1.6 percent compared with the previous week but was down 13.8 percent compared with the same week one year earlier.Fixed mortgage rates decreased:
The seasonally-adjusted Purchase Index decreased by 2.3 percent to 393.6 from 403.0 the previous week whereas the Refinance Index decreased by 0.6 percent to 1574.5 from 1583.6 one week earlier.
The average contract interest rate for 30-year fixed-rate mortgages decreased to 6.31 percent from 6.42 percent ...Change in mortgage applications from one year ago (from Dow Jones):
The average contract interest rate for one-year ARMs increased to 5.68 percent from 5.64 percent ...
| Total | -13.8% |
| Purchase | -11.7% |
| Refi | -16.9 |
| Fixed-Rate | -7.0% |
| ARM | -27.1% |
Purchase activity is off 12% from the same week in 2005 and overall mortgage activity is off 14%.
CSM: 'Homeowners stretched perilously'
by Calculated Risk on 3/22/2006 01:42:00 AM
The Christian Science Monitor reports: Homeowners stretched perilously. Excerpts:
Fully 27.1 percent of [Boston's] homeowners with a mortgage spent at least half their gross income on housing in 2004, according to the latest census figures available. Those costs, which include utilities and insurance as well as mortgage payments, were more than double the national rate of 11.7 percent and topped New York (25.9 percent), Los Angeles (26.5), San Francisco (20.4), and Chicago (20.3). Of the 25 biggest cities, only Miami had a higher rate (35.8 percent).Whatever happened to the 33% / 40% guidelines? Lenders used to require that mortgage payments didn't exceed 33% of a borrowers gross income and total debt payments couldn't exceed 40%.
The number of homes sold in Massachusetts dropped a whopping 21 percent in January compared with a year ago, the largest year-to-year decrease in monthly home sales in a decade. As a result, home values have begun to soften. Statewide, they actually fell slightly in January compared with a year ago.And there is the risk from exotic loans:
Such pressures are forcing a rising number of homeowners to erase their debts by forfeiting their homes. Foreclosure filings in the county that includes Boston nearly doubled in January from a year ago, ForeclosuresMass. says.
Mortgages are also riskier for many today. When 30-year, fixed-rate mortgages were standard, a rise in interest rates would have little effect on current homeowners. But in an era of adjustable-rate loans, it can exact a toll.
...
"This is the first decade that we have had this culture of pricing risk in home lending," says Susan Wachter, professor of real estate at the University of Pennsylvania. "What happens if someone loses a job?... If you are already spending 50 percent of your income toward a mortgage, there is no cushion."
Tuesday, March 21, 2006
UAE, Saudi considering to move reserves out of dollar
by Calculated Risk on 3/21/2006 05:15:00 PM
Forex reports: UAE, Saudi considering to move reserves out of dollar
WASHINGTON — A number of Middle Eastern central banks said on Tuesday they would seek to switch reserves from the US greenback to euros.
The United Arab Emirates said it was considering moving one-tenth of its dollar reserves to the euro, while the governor of the Saudi Arabian central bank condemned the decision by the United States to force Dubai Ports World to transfer its ownership to a ‘US entity,’ the UK Independent reported.
“Is it protectionism or discrimination? Is it okay for US companies to buy everywhere but it is not okay for other companies to buy the US?” said Hamad Saud Al Sayyari, the governor of the Saudi Arabian monetary authority.
The head of the United Arab Emirates central bank, Sultan Nasser Al Suweidi, said the bank was considering converting 10 per cent of its reserves from dollars to euros.
“They are contravening their own principles,” said Al Suweidi. “Investors are going to take this into consideration (and) will look at investment opportunities through new binoculars.”
The Commercial Bank of Syria has already switched the state’s foreign currency transactions from dollars to euros, Duraid Durgham head of the state-owned bank said. The decision by the bank of Syria follows the announcement by the White House calling on all US financial institutions to end correspondent accounts with Syria due to money-laundering concerns.
Syria’s Finance Minister Mohammad Al Hussein said: “Syria affirms that this decision and its timing are fundamentally political.”
Housing: A 'Painful' Soft Landing?
by Calculated Risk on 3/21/2006 09:42:00 AM
Jonathan Lansner writes in the OC Register: Even a 'soft landing' for home prices can be painful [for Orange County]. A few excerpts:
The much-discussed "soft landing" – where home appreciation moderates down to historical norms, or slightly lower – may create heartburn in the business climate.On mortgage equity withdrawal:
This year, the local housing market has started off slowly. Prices are still at last August's level. And sales activity hasn't been this sluggish since 1997. Forget the doomsday predictions of a market in a downward spiral. Just imagine how difficult it could be for the economy to thrive in what some might call a normal housing market.
Everyday folks have reaped rewards in several ways. Most notable: Borrowing against the profits in their home.And on housing related employment:
For example, 72,000 Orange Countians last year took out $6.1billion worth of home-equity loans, according to DataQuick. Curiously – and a possible sign of a slowing real estate market – that's down from 88,500 equity loans worth $7.2billion in 2004.
The cold cash generated by real estate isn't the only thing that's let consumers shop until they drop. It's that perception of housing wealth that's allowed them to spend freely.
By my math, real estate of all sorts – from lending to building to brokers to swabbing the floors of office towers – employed 253,000 in the fourth quarter of 2005.See the article for a graphic on housing related employment in OC.
That's up almost 80 percent since 1995. The boom turned the real estate community, so to speak, into 17 percent of all workers employed in Orange County.
Sunday, March 19, 2006
New Home Sales and Recessions
by Calculated Risk on 3/19/2006 11:30:00 PM
This is just a reminder of the historical relationship between falling New Home Sales (units) and recessions.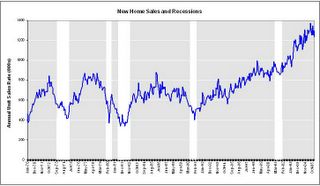
Click on graph for larger image.
The white columns are economic recessions as defined by NBER.
For consumer led recessions (all but the most recent recession in 2001), New Home Sales were falling prior to the onset of the recession. It appears that New Home Sales peaked last year and it would be concerning if they fell 20% or more from the most recent peak (to below 1.05 million units). New Home Sales for February will be released on Friday and are expected to be around 1.2 million units (SA, annual rate). It is also important to note that unit volumes have not fallen very far from the peak of 2005.
This doesn't imply a cause and effect relationship, but it is something to watch. If New Home Sales can stay above 1.1 million or so that probably increases the probabilities of a soft landing (just slower growth), as opposed to a hard landing (a recession).

