by Calculated Risk on 5/02/2006 05:37:00 PM
Tuesday, May 02, 2006
2006: Record Real Gasoline Prices?

Click on photo for larger image.
Photo taken May 2, 2006 at the gas station nearest my home.
And here is a photo of the same station taken way back on April 20, 2006.
The EIA provides historical data on oil and gasoline prices.
Using the EIA data, this graph shows the annual average real and nominal gasoline prices since 1919. Real gasoline prices have declined steadily for the last 85 years, with a few exceptions: real prices rose during the Depression and during the two supply driven oil shocks in the 1970s.
And real prices have been rising for the last few years. If the average price for gasoline is just over $3.00 per gallon this year, 2006 will set a new record for real gasoline prices.
Monday, May 01, 2006
GDP and Mortgage Interest
by Calculated Risk on 5/01/2006 11:59:00 PM
Homeowners continued to borrow substantially against their homes in Q1 2006 according to the BEA. Hence the strong increase in Personal Consumption Expenditures (PCE) and GDP in Q1 ... and the negative savings rate.
For some graphs, see my post on Angry Bear: GDP and Mortgage Interest
I will calculate Mortgage Equity Withdrawal (MEW) when the FED's Flow of Funds reports is released in June.
Energy Secretary Bodman: 'Demand Exceeds Supply'
by Calculated Risk on 5/01/2006 01:41:00 AM
UPDATE: on the same theme, see pgl's Gasoline Prices: Russert Tries Demand & Supply, and Dr. Hamilton's More political pandering and Mish's humorous take: Panic Over Oil
MarketWatch quotes Energy Secretary Samuel Bodman saying "Demand exceeds supply" in the market for gasoline. Here is the excerpt:
"Suppliers have lost control of the market," Bodman told NBC's Tim Russert, when asked what the reason for the latest spike in U.S. gas prices. "Therefore demand exceeds supply."I don't think 'demand exceeds supply'. Too funny.
For some reason, relatively high gasoline prices bring out the silly comments and dumb proposals. Senator Frist has proposed sending most Americans a check for $100 - he is thinking small - why not $1 million?
And some Senate Democrats have proposed a 60-day Moratorium on gasoline taxes. Wouldn't that encourage demand?
And Condoleezza Rice proclaimed:
"... if anything has surprised me as secretary of state, it is the degree to which the kind of search for hydrocarbons is distorting international politics."This was a surprise?
Both the supply and demand curves for oil and gasoline are very steep. Demand is fairly inelastic over a wide range of prices and supply is essentially fixed in the short term (it takes time and significant investment to bring new product to market). Any short term proposal has to be aimed at reducing demand - like increasing the gasoline tax, not decreasing it.
But raising the gasoline tax has political ramifications - remember this Bush Ad?
In the 30-second spot that harkens to the bumbling Keystone cops of the black-and-white silent movie era, an announcer says, "Some people have wacky ideas. Like taxing gasoline more so people drive less. That's John Kerry." The ad's image is of 1920s-vintage cars going around in circles.Also the impact of high gasoline prices falls disproportionately on lower income Americans. That is the problem with a short sighted energy strategies - like giving tax credits to companies that buy large SUVs. On this point, Josh Bolten is correct:
"This is a very large problem ... It's not going to be solved in the short run by some silver bullet."So lets get started. And remember the goal is to significantly reduce total oil consumption. This will reduce the price of oil and gasoline, help with Global Warming, and as the Secretary of State just realized, positively impact international politics.
Hurricanes: Sea Surface Temperatures
by Calculated Risk on 5/01/2006 01:07:00 AM
Hurricane season officially starts June 1st. NOAA offers this resource page to track Sea Surface Temperatures (SST) around the World.
UPDATE: April 28, 2005 vs. April 28, 2006 (sorry for leaving off dates!)
Here are two animations comparing 2005 (land in pink) to 2006 (land in green). The first image shows that most of the Atlantic and the Caribbean are slightly cooler this year.
The second image shows the Gulf of Mexico. The GOM is clearly warmer in 2006.
Friday, April 28, 2006
NAHB: Economists Predict Soft Landing For Housing
by Calculated Risk on 4/28/2006 08:09:00 PM
From the National Association of Home Builders (NAHB): Economists Predict Soft Landing For Housing
After soaring to record levels for three consecutive years, the single-family housing market is gliding toward a “soft landing” in 2006, as rising interest rates, affordability issues and a reduced role for investors/speculators contribute to a softening in demand, according to economists at the National Association of Home Builders (NAHB) Construction Forecast Conference in Washington, D.C. on April 27.The forecast: Sales down 12% in 2006.
"After topping out in the third quarter of last year, it is pretty clear that the housing sector is in a period of transition. Sales and starts are trending lower toward more sustainable levels," said NAHB Chief Economist David Seiders. Even so, the slowing housing market is not likely to derail the expansion as housing yields its position as the economy’s major growth engine to other sectors, he added.
Expressing a similar assessment, Michael Moran, chief economist at Daiwa Securities America Inc., said: "The housing sector is going through an adjustment, not a collapse."
Taking a bullish view on the current economic and inflation outlook, Jim Glassman, managing director and senior policy strategist with JP Morgan Chase & Co., said these factors will bode well for housing.
"Real estate is pricing itself back to reality and in the long-run it is reasonable to expect starts in the 1.8 million to 2 million range," said Glassman. "Housing won't continue to make the same contribution to the economy that it has. But when I think about where the economy is, I think we're in the fifth inning with a good chance of going into extra innings. This expansion may prove to be the longest one ever seen."
Looking to the future, Seiders said that new home sales in the first quarter of this year were down 10 percent from the fourth quarter in 2005, and that he expects them to ease further in the coming months before leveling off in 2007.And on the "Housing Bubble":
NAHB is forecasting that new home sales will hit 1.13 million units in 2006, down 12 percent from last year’s all-time high of 1.28 million units, and then move down slightly in 2007 to 1.09 million.
"Hopefully, most of this decline will be due to investors and speculators stepping out of the market. What we don’t want to see is investors dumping homes on the market," said Seiders.
After posting a record 1.716 million single-family starts in 2005, NAHB is predicting that new home construction will level off to 1.595 million units in 2006 and 1.488 million in 2007, which would still rank high by historical standards.
Commenting on the dramatic home price increases in many markets in recent years, Seiders said home price appreciation is expected to fall from an average 12 percent in 2005 to about 4 percent in 2007 and that mortgage rates should move up to 6.7 percent later this year.
Addressing a question that has generated endless speculation in recent years, Thomas Lawler, a housing and mortgage market consultant who worked for Fannie Mae for 22 years, said “Was there a national bubble? Nationwide, no, but in some regions, absolutely."
Lawler, who spoke on house prices and local dynamics, noted that in some areas, "all of the signs of a bubble were present: a surge in speculative investing; a surge in innovative financing; easy credit and loose underwriting; home inspection waivers; and home purchases sight unseen. You had to be ‘on something’ not to see a bubble in some areas," he said.
Q1 GDP, Trade and Residential Investment
by Calculated Risk on 4/28/2006 03:55:00 PM
Here are a couple of succinct reviews of the Q1 GDP report:
From Professor Polley: Strong 1st quarter growth and tame PCE deflator growth
"Today's figures on durables make up what was lost in the 4th quarter, but taken together the last 6 months have been pretty bad for durables. If that continues through the rest of the year, it will be a drag on GDP."Professor Samwick: The End of Personal Saving?
"I wonder how it can be that with the Baby Boom generation in the high-income and presumably high-saving part of its economic life cycle, we can possibly have negative saving rates for the population as a whole ..."I think the BEA might have underestimated the trade deficit for March. The BEA is estimating a surge in Goods exported in Q1, and this appears likely. However I think the BEA might be underestimating the increase in Goods imported. I'm basing this mostly on the record export / import traffic at West Coast ports in March. If I am correct, the March trade deficit might be close to $70 Billion (a new record) and Q1 GDP would then be revised down to 4.5% or so (still solid).
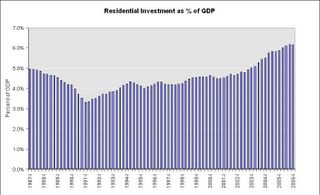
Click on graph for larger image.
Also Real Residential Investment (RI) increased 2.6% from Q4 (SA annualized). So RI grew slower than GDP in Q1 2006 and RI as a % of GDP decreased slightly. I suspect we will start seeing decreases in RI over the next few quarters and that will be a drag on GDP.
Overall this is a solid report.
Thursday, April 27, 2006
Housing and Employment
by Calculated Risk on 4/27/2006 03:13:00 PM
Here is another story on housing and employment, this one from the Contra Costa Times: 'Housing is king in East Bay employment market'
Housing has become a crucial pillar of an increasingly robust and strongly expanding East Bay economy.
Whether that's good or bad is another thing altogether.
What is clear is that the residential boom in the Alameda-Contra Costa region has fueled remarkable job gains on a number of fronts ...
Construction, finance, insurance and real estate have become the most dynamic industries in the East Bay.
"We are in a construction-driven economy, top to bottom," said Christopher Thornberg, an economist with the UCLA Anderson Forecast. "Things are being driven in large part by real estate, and housing is going to leave the economy in a big way over the next year.
"What's unclear is how much oomph will leave the East Bay economy," Thornberg said.
...
Housing generates jobs
Three industries that are directly or indirectly linked to the housing market have accounted for a significant number of jobs in the East Bay over the past year. No one can say definitively how many jobs resulted specifically because of housing, but the numbers are striking nonetheless.
Construction, real estate and finance/insurance combined to generate about 12,000 new East Bay jobs over the last 12 months -- that's 52 percent of the 23,000 new jobs in the two-county region over the same time period.
"Jobs are jobs, and that's good, and that produces income," Thornberg said. "But you hope that some of the other industries will replace any losses when housing slows down. Professional services, transportation, maybe even a little manufacturing, will start to pick up the slack."
...
In the past year, construction was the champ of employment generation with 8,200 added jobs. But other East Bay industries unrelated to housing also created plenty of jobs:
• Leisure and hospitality, 3,400 jobs
• Retail, 2,900 jobs
• Professional and business services, 2,900 jobs
• Finance and insurance, 2,600 jobs
• Health care, 2,200 jobs.
Bernanke on Housing
by Calculated Risk on 4/27/2006 10:15:00 AM
Bernanke is testifying this morning before the Joint Economic Committee. Here are his prepared remarks on the Outlook for the U.S. economy. Excerpts on housing:
Based on the information in hand, it seems reasonable to expect that economic growth will moderate toward a more sustainable pace as the year progresses. In particular, one sector that is showing signs of softening is the residential housing market. Both new and existing home sales have dropped back, on net, from their peaks of last summer and early fall. And, while unusually mild weather gave a lift to new housing starts earlier this year, the reading for March points to a slowing in the pace of homebuilding as well. House prices, which have increased rapidly during the past several years, appear to be in the process of decelerating, which will imply slower additions to household wealth and, thereby, less impetus to consumer spending. At this point, the available data on the housing market, together with ongoing support for housing demand from factors such as strong job creation and still-low mortgage rates, suggest that this sector will most likely experience a gradual cooling rather than a sharp slowdown. However, significant uncertainty attends the outlook for housing, and the risk exists that a slowdown more pronounced than we currently expect could prove a drag on growth this year and next. The Federal Reserve will continue to monitor housing markets closely.
Wednesday, April 26, 2006
New Home Sales YTD
by Calculated Risk on 4/26/2006 11:50:00 AM
Is housing slowing? Looking at New Home Sales, the answer is unequivocally yes.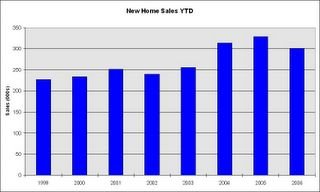
Click on graph for larger image.
New Home Sales for 2006 are below both 2004 and 2005. In February I cautioned "One month does not make a trend, but New Home Sales have fallen in six of the last seven months."
That same caution applies to the March numbers. New Home Sales have now fallen six of the last eight months - a definite down trend. But 2006 is still the third best year so far. 
This graph (from the previous post) shows the reported sales (NSA) by month for the last four year. For each month, sales for 2006 have been below 2005.
The reason I follow housing so closely is I expect a slowing housing market to impact the economy.
However, as I wrote last month, "I'd be very concerned if New Home Sales fall below about 1.05 million units annual rate for several months." That hasn't happened for even one month yet.
March New Home Sales: 1.213 Million
by Calculated Risk on 4/26/2006 10:01:00 AM
According to the Census Bureau report, New Home Sales in March were at a seasonally adjusted annual rate of 1.213 million. February's sales were revised down slightly to 1.066 million.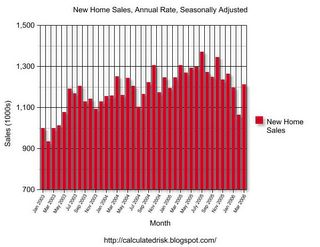
Click on Graph for larger image.
NOTE: The graph starts at 700 thousand units per month to better show monthly variation.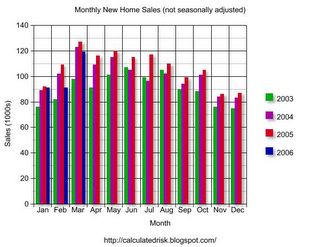
The Not Seasonally Adjusted monthly rate was 119,000 New Homes sold. There were 127,000 New Homes sold in March 2005.
On a year over year basis, March 2006 sales were 7.2% lower than March 2005.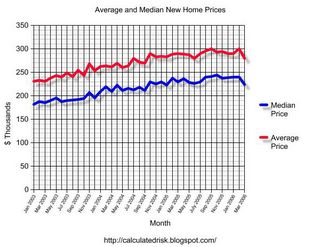
The median and average sales prices declined.
The median sales price of new houses sold in March 2006 was $224,200; the average sales price was $279,100.
The seasonally adjusted estimate of new houses for sale at the end of March was 555,000. This represents a supply of 5.5 months at the current sales rate.
The 555,000 units of inventory is another all time record for new houses for sale. On a months of supply basis, inventory is significantly above the level of recent years.
Although sales bounced back in March from the February lows, this report shows that the housing market continues to slow down.


