by Calculated Risk on 5/24/2006 07:31:00 PM
Wednesday, May 24, 2006
Bangalore: New Home Sales – Headline Is Deceptive, Momentum Is Weak
Asha Bangalore writes: New Home Sales – Headline Is Deceptive, Momentum Is Weak
"Sales of new homes rose 4.9% in April, which appears stronger than predictions. However, revisions to estimates of prior months indicate this perception is incorrect. The levels of sales of new homes in the January-March period were revised down (see table 1). As a result of this, the declines now reported for January and February are larger than the changes reported in March and the gain reported for March is slightly lower. Forecasts for sales of new homes in March were based on the original estimate of sales in March -- 1.213 million units. The level of sales in April at 1.198 million units is now lower than the original estimate reported for March. The main message is that the momentum in the market for new home is weak"Yeah, the headlines were wrong. Check out her graphs too.
April New Home Sales: 1,198,000
by Calculated Risk on 5/24/2006 09:52:00 AM
According to the Census Bureau report, New Home Sales in April were at a seasonally adjusted annual rate of 1.198 million. March's sales were revised down to 1.142 million.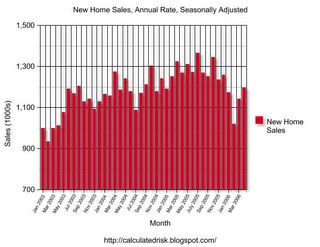
Click on Graph for larger image.
NOTE: The graph starts at 700 thousand units per month to better show monthly variation. New Home Sales peaked in July '05 and is now trending down.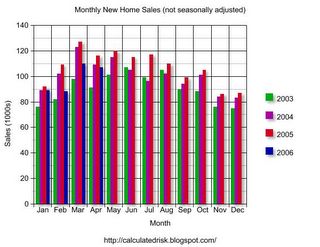
The Not Seasonally Adjusted monthly rate was 107,000 New Homes sold. There were 116,000 New Homes sold in April 2005.
On a year over year basis, April 2006 sales were 7.8% lower than April 2005. Also, April '06 sales were about 2% below April '04.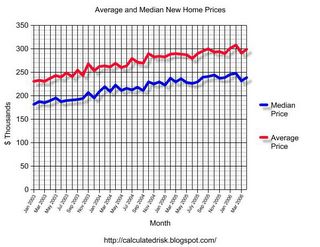
The median and average sales prices were essentially flat. Caution should be used when analyzing monthly price changes since prices are heavily revised.
The median sales price of new houses sold in April 2006 was $238,500; the average sales price was $298,300.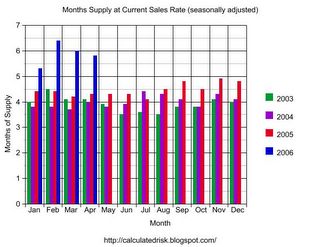
The seasonally adjusted estimate of new houses for sale at the end of April was 565,000. This represents a supply of 5.8 months at the current sales rate.
The 565,000 units of inventory is another all time record for new houses for sale. On a months of supply basis, inventory is significantly above the level of recent years.
Some people might be interested in looking at the charts for March. The only reason April sales are higher than March is because March was revised down from 1.213 million.
I expect April sales to be revised down too. This report shows that the housing market continues to slow down.
MBA: Mortgage Application Volume Declines 6%
by Calculated Risk on 5/24/2006 08:43:00 AM
The Mortgage Bankers Association (MBA) reports: Mortgage Application Volume Declines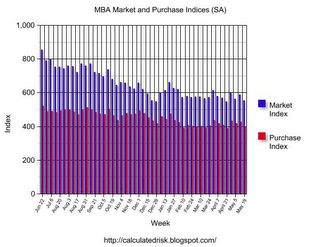
Click on graph for larger image.
The Market Composite Index, a measure of mortgage loan application volume, was 552.6, a decrease of 6.0 percent on a seasonally adjusted basis from 588.0 one week earlier. On an unadjusted basis, the Index decreased 6.2 percent compared with the previous week and was down 23.0 percent compared with the same week one year earlier.Mortgage rates decreased slightly:
The seasonally-adjusted Purchase Index decreased by 7.1 percent to 396.4 from 426.7 the previous week whereas the Refinance Index decreased by 4.3 percent to 1480.5 from 1546.8 one week earlier...
The average contract interest rate for 30-year fixed-rate mortgages decreased to 6.61 percent from 6.66 percent ...Change in mortgage applications from one year ago (from Dow Jones):
The average contract interest rate for one-year ARMs decreased to 6.02 percent from 6.07 percent ...
| Total | -23.0% |
| Purchase | -17.1% |
| Refi | -31.7% |
| Fixed-Rate | -17.9% |
| ARM | -32.5% |
Using the MBA weekly data, it appears purchase activity in May '06 will be about 15% below May '05.
Tuesday, May 23, 2006
Toll Bros Warns
by Calculated Risk on 5/23/2006 02:59:00 PM
From Dow Jones: Housing Downturn Taxes Toll Brothers
Toll Brothers ... slashed guidance for fiscal 2006 as the company continues to struggle with sluggish sales and big inventories.I expect inventories to continue to rise all summer. And sales to continue to fall.
...
Toll blames the weak market conditions on big inventories in the market ... Exacerbating the situation further is a surge in cancellations and a glut of speculative homes built by home builders sitting in the market.
"We believe that once this excess inventory is absorbed, demand should once again exceed supply," Toll said. When this happens, "we believe those buyers who have been on the sidelines will come back into the market and prices should start to rise again."
...
Banc of America analyst Daniel Oppenheim, who rates the company at sell, is skeptical demand will rebound in the second half of fiscal 2006.
"We remain concerned that supply has not slowed sufficiently to result in improving inventory levels and expect the slowdown may impact the market far longer," Oppenheim said.
Monday, May 22, 2006
Fed's Fisher: Housing Cooling, Inflation too High
by Calculated Risk on 5/22/2006 05:17:00 PM
From Reuters: Fed's Fisher says inflation running too high
Dallas Federal Reserve Bank President Richard Fisher on Monday said U.S. inflation was running too high for comfort ...Here is the Trimmed-Mean PCE Inflation Rate from the Dallas Fed.
"I think we must continue to be wary of the onset of inflation and the onset of inflation expectations," Fisher told reporters ... "I am guided by what we call the trimmed mean PCE (calculated by the Dallas Fed) ... I personally believe it is a better measure. It is time-tested. ... The trimmed-mean PCE ... gives rise to some discomfort on my part, but we shall see what ensues."
The Dallas Fed's last release showed its trimmed mean PCE inflation measure rising by 2.3 percent over the 12 months to March. April's data will be released on Friday.
And on housing:
Fisher ... said that while the U.S. housing market appeared to be moderating, there was still a lot of strength in the economy.Here is Fisher's speech: Globalization's Impact on U.S. Growth and Inflation
"(Housing) is clearly cooling ... there are other offsets -- there is a very big expansion in capex and business expenditure ... the real issue is what will be the impact on consumption," he said.
Lowe's Cautions
by Calculated Risk on 5/22/2006 02:24:00 PM
Following Home Depot, Lowe's is reporting that Q2 might be "soft". From TheStreet.Com:
On a conference call, Lowe's management said May same-store sales were running at the low end of its guidance for 3% to 5% growth. After Lowe's larger competitor, Home Depot, also reported top-line softness for its first quarter, investors are worried that the nation's home-improvement chains, longtime beneficiaries of the U.S. housing boom, could feel pain if the situation deteriorates.My guess is this "softness" is because of the slowing housing market, rather than higher gas prices. With less home equity extraction, I'd expect fewer home remodeling projects.
"This ties in with higher gas prices and is a more direct signal of at least weaker spending trends than others that pointed to similar trends last week," said Credit Suisse First Boston analyst Gary Balter in a research note. "In a nervous market where concerns over interest rates and the direction of the economy are leading stocks down, this will add fuel to the fire."
Sunday, May 21, 2006
Las Vegas: Home sellers beware
by Calculated Risk on 5/21/2006 04:23:00 PM
From the Las Vegas Sun: Home sellers beware 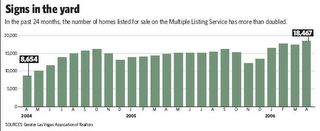
Click on graph for larger image.
... a number of home-sale indicators show how the Las Vegas Valley is now experiencing a buyer's market.This same story - a buyers market with rising inventories - is being repeated in many housing markets. See this site for other markets: Bubble Markets Inventory Tracking
A record number of resale houses - 18,467 in April - are on the market, along with another 4,000 new homes.
Resale houses are taking longer to sell - up to three or four months, compared to two weeks or less when the market was hot - and some sellers are accepting lowball offers.
Builders are offering purchase incentives, including free lawn maintenance, swimming pools, washers and dryers and even the cost of packing and moving customers into their new residences. Some incentive packages have been valued by builders at up to $100,000.
Builders are offering higher commissions to real estate agents - up to 6 percent in some cases.
With contract cancellations reaching 38 percent in some new subdivisions, builders are cutting staff and prices on new homes by tens of thousands of dollars.
Saturday, May 20, 2006
Lansner: Q&A with Mortgage Broker
by Calculated Risk on 5/20/2006 10:15:00 PM
Here is OC Register's Jonathan Lansner Q&A with local mortgage broker Norm Bour: Insider Q&A: A lender's perspective. A few excerpts:
Q. How slow is it?
A. No question loan originations are down, both in the purchase and the refi market. Speaking for myself we're down by 40-50% year-to-date since last year and certainly the year prior and most people I know are saying the same.
Q. What does the kind of business you're doing today say about the state of the O.C. housing market?
A. I can only speak for myself, but ... We're concerned. ... If the economy DOES become soft (likely), and people are pressured, will they SELL to get out of their jam or refi to get cash out even at a higher rate than they have now?
Q. What's the most popular loan today? Why? Is that different from, say, a year ago?
A. ... the majority of people are still going with (adjustable) ARMs, though more hybrid ARMs rather than the more volatile Option ARMs. I'd say 5/1 (5-year-fixed,) 7/1 (7-year-fixed,) and 10/1 (10-year-fixed,) are the majority of what people want.
Friday, May 19, 2006
California Construction Employment Falls
by Calculated Risk on 5/19/2006 04:15:00 PM
 Click on graph for larger image.
The California Employment Development Department reports that seasonally adjusted California construction employment fell by 8,300 in April. This followed a loss of 9,900 construction jobs in March.
For overall employment:
California's seasonally adjusted unemployment rate was 4.9 percent in April, up 0.1 percentage point from the revised rate in March, and down 0.5 percentage point from one year ago. In comparison, the U.S. unemployment rate was 4.7 percent in April remaining unchanged from the rate in March, and down 0.4 percentage point from one year ago.
There were 14,951,100 seasonally adjusted jobs in total nonfarm industries in April, down 2,600 jobs from last month. This followed a 13,400-job loss in March and a 31,400-job gain in February.
 The second graph shows construction employment as a % of total employment in California. Note that "construction" includes non-housing related construction too - so this is just a general guide to the impact of the housing slowdown. Also, there are many other housing related jobs (real estate agents, mortgage brokers, etc.) that will also be impact by the housing slowdown.
For California, Dr. Thornberg estimates:
Construction employment will lose 200,000 jobs statewide over the next three years, with an additional unknown number of jobs lost in the informal sector.This is just the beginning of the job losses.
For Arizona see: Housing decline triggers layoffs
Housing Busts: Looking Back
by Calculated Risk on 5/19/2006 02:13:00 PM
Greenspan says the housing boom is over. Bernanke suggests the cooling is "orderly". Leamer and Thornberg predict prices will be flat for a number of years, unless employment falls. What is likely to happen?
Although every bust is different, and this boom was larger than previous booms (so the bust might be worse), taking a look back at previous busts might give us an idea of what to expect:
Housing "bubbles" typically do not "pop”, rather prices tend to deflate slowly in real terms, over several years. Historically real estate prices display strong persistence and are sticky downward. Sellers want a price close to recent sales in their neighborhood, and buyers, sensing prices are declining, will wait for even lower prices. This means real estate markets do not clear immediately, and what we usually observe is a drop in transaction volumes.
Even though prices tend to deflate slowly, they can still drop significantly over time. On the following graph are the nominal price declines for three busts: Los Angeles in the early '90s, San Antonio in the mid '80s (the oil patch bust) and Hartford starting in '89. The peaks of all three housing booms are aligned on the left and the relative price declines are plotted by quarter after the local market’s price peak.
 Click on graph for larger image.
For all three busts, the prices steadily declined over many quarters. Although these are three of the worst busts of the last 25 years, the price action is representative of other housing busts. In real terms (adjusted by CPI less shelter), the price declines are even more dramatic:

Data Sources: OFHEO House Price Index, BLS CPI less Shelter.
In real terms, prices in the Hartford market declined for over 8 consecutive years before reaching a nadir of almost 40% off the peak price of 1989. The other markets experienced similar declines:
Percent Decline (Real and Nominal), Years from Peak to Trough Real Years Nominal Years Decline Decline Los Angeles 34% 6 3/4 21% 6 3/4 San Antonio 33% 4 3/4 18% 4 Hartford 39% 8 1/4 15% 6 1/2
NOTE: Most of this post is excerpted from my post last year on Angry Bear: After the Boom.


