by Calculated Risk on 5/30/2006 09:44:00 AM
Tuesday, May 30, 2006
Fannie Mae's Berson on Housing
Fannie Mae Economist David Berson writes: Housing continues to weaken, although it's not collapsing.
Most of the latest data on housing activity show that this sector continues to weaken ... With mortgage rates edging upward, economic growth moderating, and home price appreciation slowing (and in some areas falling, thus reducing investor demand), the prospects of a bounce-back for the housing market this year appear to be dim.Here is a chart of New Home Sales through April:
...
Even with these declines in housing activity ... we continue to project the third strongest year ever for 2006 -- even with sales down by 7-10 percent. In fact, total home sales would have to decline by more than 20 percent in 2006 for sales this year to fall out of the top-three years -- highly unlikely in a non-recession year.

Click on graph for larger image.
As Berson noted, 2006 is on track to be the third strongest year ever behind 2005 and 2004. New Home Sales are off 11.2% YTD compared to 2005.
Berson's numbers are slightly different because he includes Existing Home Sales.
Monday, May 29, 2006
Barron's: The Big Glut
by Calculated Risk on 5/29/2006 12:24:00 PM
Barron's cover story is about the second home glut: The Big Glut
A couple of quotes:
"If you want to sell, you've got to go back to '04 prices," says Chip Harris of Coldwell Banker Previews International
"People don't believe in the laws of supply and demand anymore," says Alan Skrainka, chief market strategist at Edward Jones. "We're not saying it's a bubble, but we're saying prices are overstated and will likely correct 20% to 25% over four or five years."
Sunday, May 28, 2006
OFHEO: House Price Index
by Calculated Risk on 5/28/2006 04:49:00 PM
The Q1 OFHEO House Price Index will be released on Thursday, 10 A.M. EST. The headline number is the year over year price increase - and that will still be positive.
However, I expect the US and many Metropolitan Statistical Area's (MSA) might see negative Q1 appreciation declining prices. Those will be the interesting numbers.
Here are the last 3 quarters:
2005 Q2 3.65%So even if Q1 2006 shows
2005 Q3 3.14%
2005 Q4 2.86%

Click on graph for larger image.
"We've never had a decline in housing prices on a nationwide basis."
Ben Bernanke, July 29, 2005
The US hasn't seen
Housing: More Inventory
by Calculated Risk on 5/28/2006 01:00:00 AM
The Virginia MLS provides several charts of existing home inventory. The following chart is for Fairfax County:
Click on graph for larger image.
For other markets, see: Bubble Markets Inventory Tracking. Here are the number of listings for San Diego:
2/05: 8,500 (SD Union Tribune)
7/05: 14,176___7/05 sold: 4,765___7/04 sold: 5,658
8/05: 15,240___8/05 sold: 5,379___8/04 sold: 5,580
9/05: 16,081___9/05 sold: 4,935___9/04 sold: 5,177
10/05: 16,490__10/05 sold: 4,155___10/04 sold: 4,758
11/05: 16,072__11/05 sold: 3,937___11/04 sold: 4,350
12/05: 14,591__12/05 sold: 4,262___12/04 sold: 4,807
2006
1/1: 13,916
1/10: 14,840
1/20: 15,643
1/30: 16,161___1/06 sold: 2,763___1/05 sold: 3,324
2/10: 16,601
2/20: 16,981
2/28: 17,262___2/06 sold: 2,865__2/05 sold: 3,442
3/10: 17,648
3/20: 18,003
3/31: 18,261___3/06 sold: 4,146__3/05 sold: 5,018
4/10: 18,531
4/20: 19,069
4/22: 19,260
4/30: 19,480___4/06 sold: 3,705__4/05 sold: 5,345
5/10: 20,009
5/20: 20,617
5/23: 20,788
5/24: 20,836
5/25: 20,901
5/27: 21,106
Thursday, May 25, 2006
Core PCE
by Calculated Risk on 5/25/2006 06:05:00 PM
UPDATE: Dr. Altig has a great summary PCE Inflation: Not Horrible, Not Good. His take:
Which means, I think, that everyone walked away from the report believing just about what they believed before the report.
Since I will not be here tomorrow AM, and we are now "data dependent", here is the place to look for the core PCE:
News Release: Personal Income and Outlays. Right now this directs you to the release for March, but it take you to the April report after 8:30 AM ET on May 26th.
Check Table 9 for "PCE excluding food and energy". No matter what you think about reported inflation, this is one of the key numbers for the FED. According to Rex Nutting at MarketWatch, the market expectation is 0.2%.
Economists surveyed by MarketWatch are forecasting a 0.2% increase in core inflation after a 0.3% gain in March.A higher number will probably mean the FED is leaning towards another rate hike in June.
But even 0.2% has a pretty wide range. If its closer to 0.25% that is about 3% annualized (0.15% is about 1.8% annualized).
You can calculate the actual number using the Chain-type price indexes, also in Table 9. The math is simple: divide April by March and subtract 1. For March, the reported increase was .3%. The actual increase for March was 110.941 divided by 110.586 = 0.32% or 3.9% annualized.
Table 11 presents the annual increase (YoY) of core PCE.
There is one more CPI release (Jun 14, 2006) before the June 28/29 Fed meeting.
Finally, the Dallas Fed provides a slightly different measure: Trimmed-Mean PCE Inflation Rate. This will also be interesting to check (I'm not sure when they will release the data for April - but probably some time on Friday).
Best to all.
Slowing Job Market?
by Calculated Risk on 5/25/2006 12:13:00 PM
In addition to revised GDP and Existing Home Sales, there were a couple of employment related indicators released this morning.
For Initial Claims:
In the week ending May 20, the advance figure for seasonally adjusted initial claims was 329,000, a decrease of 40,000 from the previous week's revised figure of 369,000. The 4-week moving average was 337,000, an increase of 3,250 from the previous week's revised average of 333,750.The number to watch is the 4-week moving average, and this has been moving up for several weeks.
From the Conference Board: Help-Wanted Advertising Index
The Conference Board Help-Wanted Advertising Index – a key measure of job offerings in major newspapers across America – dipped two points in April. The Index now stands at 35. It was 39 one year ago.I think the recent economic data is fairly weak, so I'm leaning towards the FOMC pausing in June. Unless, of course, inflation keeps rising. And that brings us to tomorrow's key number - the FED's favorite inflation indicator - the core PCE price index.
The Conference Board, the global business research and membership organization, examines each month help-wanted ads in 51 newspapers and online.
In the last three months, help-wanted advertising declined in all nine U.S. regions. Steepest declines occurred in the West South Central (-16.0%), South Atlantic (-12.9%) and East North Central (-8.9%) regions.
Says Ken Goldstein, labor economist at The Conference Board: "The latest data shows that job advertising softened in April, both in print and online. ... If the labor market experiences some softening, it could be due to a slowing in pace in the overall economy."
Existing-Home Sales Slip
by Calculated Risk on 5/25/2006 11:31:00 AM
The National Association for Realtors (NAR) reports: Existing-Home Sales Slip in April
Total existing-home sales – including single-family, townhomes, condominiums and co-ops – slipped 2.0 percent to a seasonally adjusted annual rate1 of 6.76 million units in April from a downwardly revised level of 6.90 million in March, and were 5.7 percent below the 7.17 million-unit pace in April 2005.
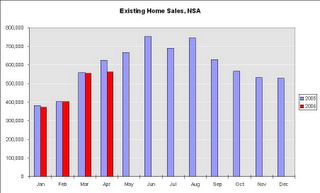
Click on graph for larger image.
This is the first month of 2006 that is significantly below the same month in 2005. April 2006 sales (NSA) were 10.1% below April 2005.
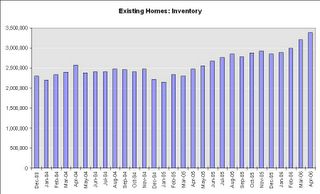
Total housing inventory levels rose 5.8 percent at the end of April to 3.38 million existing homes available for sale, which represents a 6.0-month supply at the current sales pace.
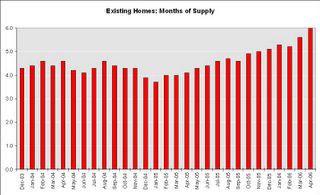
The months of supply continues to rise. Many agents feel 6 months of supply is the danger zone - any additional supply and prices will start to fall. Some areas, like Boston, have significantly more than 6 months supply, and prices are already starting to fall.
As a reminder: Existing Home Sales is a trailing indicator. The weakness in New Home Sales, the NAHB index, and the MBA Purchase Index all suggest fewer existing home sales in the coming months.
And now from the always optimistic Lereah:
"... our forecast model is showing a modest decline for the second quarter with sales leveling out before rising in the fourth quarter."
David Lereah, NAR’s chief economist
Wednesday, May 24, 2006
Bangalore: New Home Sales – Headline Is Deceptive, Momentum Is Weak
by Calculated Risk on 5/24/2006 07:31:00 PM
Asha Bangalore writes: New Home Sales – Headline Is Deceptive, Momentum Is Weak
"Sales of new homes rose 4.9% in April, which appears stronger than predictions. However, revisions to estimates of prior months indicate this perception is incorrect. The levels of sales of new homes in the January-March period were revised down (see table 1). As a result of this, the declines now reported for January and February are larger than the changes reported in March and the gain reported for March is slightly lower. Forecasts for sales of new homes in March were based on the original estimate of sales in March -- 1.213 million units. The level of sales in April at 1.198 million units is now lower than the original estimate reported for March. The main message is that the momentum in the market for new home is weak"Yeah, the headlines were wrong. Check out her graphs too.
April New Home Sales: 1,198,000
by Calculated Risk on 5/24/2006 09:52:00 AM
According to the Census Bureau report, New Home Sales in April were at a seasonally adjusted annual rate of 1.198 million. March's sales were revised down to 1.142 million.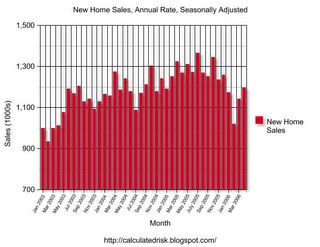
Click on Graph for larger image.
NOTE: The graph starts at 700 thousand units per month to better show monthly variation. New Home Sales peaked in July '05 and is now trending down.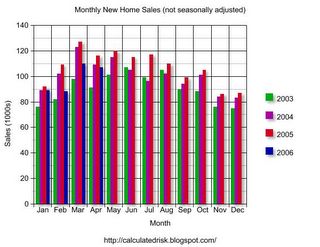
The Not Seasonally Adjusted monthly rate was 107,000 New Homes sold. There were 116,000 New Homes sold in April 2005.
On a year over year basis, April 2006 sales were 7.8% lower than April 2005. Also, April '06 sales were about 2% below April '04.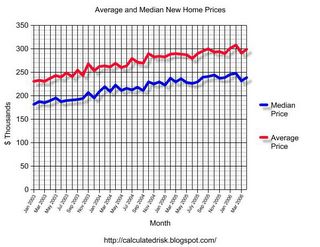
The median and average sales prices were essentially flat. Caution should be used when analyzing monthly price changes since prices are heavily revised.
The median sales price of new houses sold in April 2006 was $238,500; the average sales price was $298,300.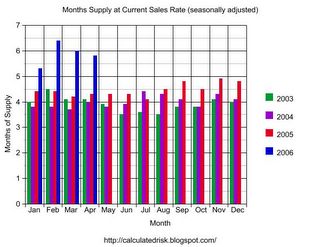
The seasonally adjusted estimate of new houses for sale at the end of April was 565,000. This represents a supply of 5.8 months at the current sales rate.
The 565,000 units of inventory is another all time record for new houses for sale. On a months of supply basis, inventory is significantly above the level of recent years.
Some people might be interested in looking at the charts for March. The only reason April sales are higher than March is because March was revised down from 1.213 million.
I expect April sales to be revised down too. This report shows that the housing market continues to slow down.
MBA: Mortgage Application Volume Declines 6%
by Calculated Risk on 5/24/2006 08:43:00 AM
The Mortgage Bankers Association (MBA) reports: Mortgage Application Volume Declines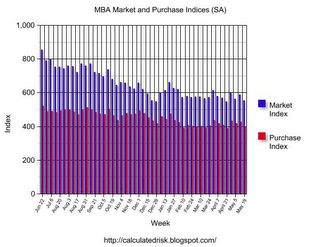
Click on graph for larger image.
The Market Composite Index, a measure of mortgage loan application volume, was 552.6, a decrease of 6.0 percent on a seasonally adjusted basis from 588.0 one week earlier. On an unadjusted basis, the Index decreased 6.2 percent compared with the previous week and was down 23.0 percent compared with the same week one year earlier.Mortgage rates decreased slightly:
The seasonally-adjusted Purchase Index decreased by 7.1 percent to 396.4 from 426.7 the previous week whereas the Refinance Index decreased by 4.3 percent to 1480.5 from 1546.8 one week earlier...
The average contract interest rate for 30-year fixed-rate mortgages decreased to 6.61 percent from 6.66 percent ...Change in mortgage applications from one year ago (from Dow Jones):
The average contract interest rate for one-year ARMs decreased to 6.02 percent from 6.07 percent ...
| Total | -23.0% |
| Purchase | -17.1% |
| Refi | -31.7% |
| Fixed-Rate | -17.9% |
| ARM | -32.5% |
Using the MBA weekly data, it appears purchase activity in May '06 will be about 15% below May '05.


