by Calculated Risk on 7/03/2006 01:46:00 PM
Monday, July 03, 2006
June: Near Record Increase in National Debt
For the first nine months of the 2006 fiscal year (starts Oct 1st), the National Debt has increased $487.3 Billion. The record is $491.1 Billion for the first nine months of fiscal 2004.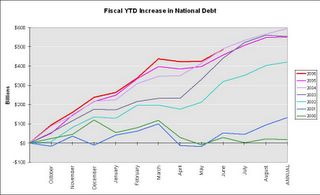
Click on graph for larger image.
As a percent of GDP, the deficit has improved slightly over the last few years.
The annual increase in the debt is running around 4.5% to 5.0% of GDP. This is a classic "structural budget deficit" or "high employment deficit" - something most economists believe should be avoided.
If someone says the deficit is falling - laugh (or cry). Its not true. For an explanation, see my post on Angry Bear: Budget Metrics and the Cheating Clotheshorse
Saturday, July 01, 2006
FED: Residential Investment over the Real Estate Cycle
by Calculated Risk on 7/01/2006 12:54:00 AM
Fed Economist Dr. Krainer writes: Residential Investment over the Real Estate Cycle (thanks to Professor Thoma for the tip!)
Note: I'm going to jump ahead in the economic letter.
For recession-related downturns, the ratio (shown in Figure 3) starts to rise on average six quarters before the actual downturn, and continues to rise for six quarters into the downturn. For the average non-recession-related downturn, the inventory ratio turns up just one quarter before the downturn and then eases back down after two quarters (which is also the average duration of a non-recession-related downturn).A key point in figure 4 is that the current behavior of inventory looks more like a recession related downturn than a non-recession related housing downturn.
This exercise indicates that prices seem to be considerably less useful predictors of downturns than quantity-type measures. This might seem surprising because, unlike sales volumes and inventories, prices have a forward-looking aspect and thus would seem to be good predictors of the future state of the housing market.
Figure 4 shows the average behavior of real new house prices leading up to and then following a peak in residential investment. The focus here is on new house prices because, presumably, they, rather than existing house prices, are most relevant for real estate developers' decisionmaking. Additionally, new house prices are likely to be more sensitive to market weakness than existing house prices. Developers are always "motivated sellers." If demand is soft, they generally do not have the option of withdrawing the house from the market and simply living in it. For recession-related downturns, the real price of new houses declines about four quarters after the peak, on average. Real new house prices register no detectable declines surrounding the average non-recession-related downturn. This basic stylized fact is even more apparent when using prices of existing homes. Only in the severest downturns do we witness real price declines, and never do these price declines come in advance of a downturn in investment.Note: bold text is added emphasis
One caveat to this analysis is that it is based on the comparison of the average behavior of a housing market series leading up to two different types of downturns in residential investment. Obviously, averaging in the figures masks a fair degree of variation across the different downturns. However, more formal statistical modeling supports the notion that variables such as sales volumes and inventory ratios yield earlier and more reliable signals when the downturn is recession-related. This is natural; recession-related downturns have tended to be more severe than the non-recession-related episodes.
It is also interesting to note that the recent behavior of the month's supply ratio bears more resemblance to the typical behavior before a recession-related downturn than to a non-recession-related downturn. Yet economists, such as those sampled in surveys of professional forecasters, are generally predicting only a moderation in overall economic growth in coming quarters. Given these conflicting observations, it is natural to wonder how much stand-alone information for predicting residential investment is contained in the housing market data. The answer, based on the last 30 years of data is mixed. If we estimate a model of the event that a residential downturn occurs using lagged values of the housing market variables mentioned above, we can generally improve the model prediction error by adding in forecasts of output growth. This suggests that it is best to consider economy-wide factors in addition to specific housing market variables when evaluating the real estate market.
Where are we now with residential investment?
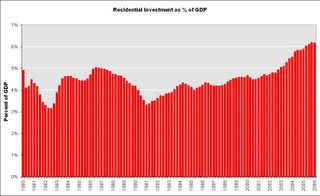
Click on graph for larger image.
This graph shows residential investment as a percent of GDP on a quarterly basis since 1980. It appears residential investment peaked in Q4 2005 and declined slightly (as a % of GDP) in Q1 2006.
Right now this housing slowdown looks more like a recession related slowdown.
On housing, also see Dr. Hamilton's All eyes on housing
"... it raises the possibility that, when the recognition does sink in, the current "gradual cooling" could quickly turn into something more impressive."
Friday, June 30, 2006
2006 Predictions: Mid-Year Review
by Calculated Risk on 6/30/2006 09:14:00 PM
Last December I tried to predict the top economic stories of 2006. It's time for a short mid-year review.
I started with four stories that I thought wouldn't be big in 2006:
1) Energy Prices: I expect oil prices to stabilize or decline next year. WTI spot prices closed at $59.96 today.
Oops. So far I've clearly been wrong on oil prices. WTI spot prices closed at $73.52 today, an increase of 22% over the last 6 months. That is a HUGE story.
2) Bush Economic proposals: I think the Bush Administration will be shackled by scandals and Iraq, so I don't expect any major new proposals. I hope I'm wrong about Iraq.
Correct so far.
3) Trade Deficit / Current Account Deficit: I could be wildly wrong here too, but I think the trade deficit will stabilize or even decline slightly next year.
Correct so far, but for the wrong reason. I thought the trade deficit would stabilize at the Q4 levels because the US economy would be slowing down.
4) The Budget Deficit: Although I expect the General Fund deficit to grow to around $600 Billion in 2006, I don't think it will become a huge story until '07 or '08.
Correct so far.
And now my top 5 predictions:
5) The End of the Greenspan Era I think Dr. Bernanke will face a significant challenge in '06, perhaps by one the following top stories - perhaps by something completely unexpected. ... When the challenge comes, expect investors to pine for their lost love: Alan Greenspan.
Bernanke hasn't faced a significant challenge yet, so it is too soon to tell.
4) Housing Slowdown: In my opinion, the Housing Bubble was the top economic story of 2005, but I expect the slowdown to be a form of Chinese water torture. Sales for both existing and new homes will probably fall next year from the records set in 2005. And median prices will probably increase slightly, with declines in the more "heated markets".
So far, so good.
3) Pension Blowup / Major Bankruptcy: Of course I am thinking GM, but maybe it will be another major corporation. Bankruptcy has become a tool to break labor agreements and terminate pension plans. ...
Nothing so far.
2) Slowing Economy: If the US and the World economies slide into recession, this will be the top story next year. I still think it is too early to call, but I do think economic growth will slow substantially next year.
Too early to say. Growth in the first quarter was definitely strong.
1) Interest Rates: Like most investors, I expect the Fed to raise the Fed Funds rate 25 bps at each of the next two meetings to 4.75% in March ... And like many observers, I expect the Fed to start lowering rates later next year as the economy slows. But here is the surprise, I think long rates will start to rise when the Fed starts cutting the Fed Funds rate.
This will be Bernanke's "conundrum"! As the economy slows, this will reduce the trade deficit and also lower the amount of foreign dollars willing to invest in the US - the start of a possible vicious cycle.
Too early to say - the FED hasn't even paused yet.
Summary: Mostly it's too soon to tell. I've clearly been wrong on oil prices and correct on the trade deficit, the budget deficit and the housing market - at least so far.
Core PCE and Savings Rate
by Calculated Risk on 6/30/2006 09:57:00 AM
The BEA reports for May:
Personal income increased $38.3 billion, or 0.4 percent, and disposable personal income (DPI) increased $31.6 billion, or 0.3 percent, in May, according to the Bureau of Economic Analysis. Personal consumption expenditures (PCE) increased $40.3 billion, or 0.4 percent.Core PCE increased 0.2 percent in May (2.6% annualized). Core PCE for May was below the April rate, but still above the high end of the FED's assumed target range (2%).

Click on graph for larger image.
The savings rate continued its downward trend. The savings rate, as a percent of DPI, was a negative 1.7%.
In the last post, the chart shows the quarterly savings rate. This post is the monthly savings rate. The Microsoft special dividend (Dec '04) and the impact of hurricane Katrina (Aug '05) are even more evident in the monthly chart.
Thursday, June 29, 2006
GDP: Q1 Personal Savings
by Calculated Risk on 6/29/2006 03:23:00 PM
Final Q1 GDP was released today and the headlines blared: First-quarter GDP growth strong
The U.S. economy grew at a revised 5.6 percent annual rate in the first quarter as the fastest pace of growth in 2-1/2 years ... The department pushed its estimate of first-quarter growth in gross domestic product up from 5.3 percent it reported a month ago.But personal savings were revised down significantly. In the prelimary Q1 GDP report, personal savings were a negative $50.5 billion and the personal saving rate was reported as a negative 0.5 percent in Q1, 2006.
In the final Q1 GDP report, personal saving were a negative $128.1 Billion, and the savings rate was a negative -1.4%; almost as bad as the Q3 2005 savings rate that was partially attributed to hurricane Katrina's impact.

Click on graph for larger image.
Hurricane Katrina impacted personal savings in Q3 2005. In Q4 2004, the Microsoft special dividend distorted the personal savings numbers. In Q3 2001, personal savings spiked due to consumers behavior following 9/11.
Even though GDP was strong in Q1, the negative personal savings rate is a concern.
Wednesday, June 28, 2006
MBA: Mortgage Rates Increase, Application Volume Declines
by Calculated Risk on 6/28/2006 09:31:00 AM
The Mortgage Bankers Association (MBA) reports: Mortgage Rates Increase, Application Volume Declines (link added)
Click on graph for larger image.
The Market Composite Index, a measure of mortgage loan application volume, was 529.6, a decrease of 6.7 percent on a seasonally adjusted basis from 567.6 one week earlier. On an unadjusted basis, the Index decreased 7.0 percent compared with the previous week but was down 31.0 percent compared with the same week one year earlier.Mortgage rates increased:
The seasonally-adjusted Purchase Index decreased by 6.2 percent to 389.0 from 414.8 the previous week and the Refinance Index decreased by 7.5 percent to 1356.0 from 1466.1 one week earlier.
The average contract interest rate for 30-year fixed-rate mortgages increased to 6.86 percent from 6.73 percent ...Change in mortgage applications from one year ago (from Dow Jones):
The average contract interest rate for one-year ARMs increased to 6.36 percent from 6.22 percent ...
| Total | -31.0% |
| Purchase | -18.2% |
| Refi | -46.4% |
| Fixed-Rate | -30.1% |
| ARM | -32.9% |
Both the Market Index and Purchase Index are at new lows for the last 3 years.
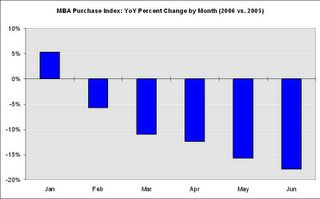
This graph shows the MBA Purchase Index percent change by month for 2006 from 2005.
Based on the MBA Purchase Index, the housing market is continuing to slow compared to 2005.
Tuesday, June 27, 2006
Merril Lynch: 40% Chance of Recession by early '07
by Calculated Risk on 6/27/2006 06:09:00 PM
From Reuters: Chances rise for housing-driven recession
Merrill Lynch economists say there is now about a 40 percent chance of a recession in the first half of 2007 -- even without a widely anticipated 25 basis-point Federal Reserve rate hike this week.In the comments to an earlier post, bbb provided links to this recession calculator (based on a method outlined by Dr. Hamilton):
...
Bernard Baumhol, executive director of The Economic Outlook Group in New York, said he believes chances of a recession in 2007 will increase to 35 percent if the federal funds rate -- at 5.0 percent going into this week's Fed policy meeting -- exceeds 5.5 percent.
"If the Fed gets to 6 percent, we're probably talking about a 50 percent probability of a recession in 2007," Baumhol said.
Reckoning the Odds of Recession
Visualizing the Probability of Recession
Using these tools, and values of 5.21% for the Ten Year, 5.05% for the 3 month, and 5.25% for the Fed Funds rate (expected), yields a probability of recession of 32%. That is the odds that America is in recession right now.
I am not ready to predict a recession, although an economic slowdown seems certain. On the other side, from the Reuters article:
'A housing-driven recession is "mathematically impossible," said Wachovia Bank senior economist Mark Vitner, because housing is derived from the rest of the economy and construction is actually a smaller portion of the U.S. economy than during the housing boom of the late 1970s. Even if home values soften in expensive markets, many homeowners are still sitting on substantial home equity cushions.'Actually housing is a much larger percentage of the economy than in the late '70s. Using data from the BEA:

Click on graph for larger image. Note: 2006 is estimated from Q1 data for both graphs.
Residential investment is a larger part of the economy now than in the late '70s.

And from the Federal Reserve Flow of Funds report:
Mortgage debt as a percent of GDP is significantly higher now than in the late '70s.
And finally from the BLS, construction employment is higher now, as a percent of total employment, than in the late '70s. From '76 to '79, construction employment was 4.7% of total non-farm employment. Today, construction employment is 5.5% of total employment.
Although wrong on the facts, Mr. Vitner is correct that a housing slowdown alone has never taken the economy into recession. And that is one of the reasons I've been hesitant to forecast a recession.
Existing Home Sales
by Calculated Risk on 6/27/2006 01:58:00 PM
The National Association of Realtors (NAR) reports: Existing-Home Sales Ease In May 
Click on graph for larger image.
Sales of existing homes experienced a minor decline in May with home prices rising near normal rates, according to the National Association of Realtors®.
Total existing-home sales – including single-family, townhomes, condominiums and co-ops – eased 1.2 percent to a seasonally adjusted annual rate1 of 6.67 million units in May from a pace of 6.75 million in April, and were 6.6 percent below the 7.14 million-unit level in May 2005.

David Lereah, NAR’s chief economist, said conditions are mixed around the country. “There’s now a clear pattern of slower home-sales activity in many higher cost markets, which are more sensitive to rises in interest rates, and higher home sales in moderately priced areas which have experienced job growth,” he said. “Although mortgage interest rates remain historically low, the uptrend in interest rates this year is affecting those buyers who are at the margins of affordability.”
...
The national median existing-home price2 for all housing types was $230,000 in May, up 6.0 percent from May 2005 when the median was $217,000. The median is a typical market price where half of the homes sold for more and half sold for less. “Overall price appreciation has returned to normal levels as the supply of homes on the market has risen to a balanced range,” Lereah said.
Total housing inventory levels rose 5.5 percent at the end of May to 3.60 million existing homes available for sale, which represents a 6.5-month supply at the current sales pace.

NAR President Thomas M. Stevens from Vienna, Va., said it’s important to keep the current market in perspective. “We didn’t break the 6-million sales barrier until 2003, so the current level of home sales is still pretty healthy by historic standards,” said Stevens, senior vice president of NRT Inc. “Housing is continuing to support the overall economy by providing a sound foundation for other sectors to grow – the normalization that is taking place in the housing market is good for the long-term health of the industry.”Existing Home Sales are a trailing indicator. The sales are reported at close of escrow, so May sales reflects agreements reached in March and April.
Usually 6 to 8 months of inventory starts causing pricing problem - and over 8 months a significant problem. Current inventory levels are now in the danger zone.
Monday, June 26, 2006
May New Homes Sales: 1,234,000 Annual Rate
by Calculated Risk on 6/26/2006 10:12:00 AM
According to the Census Bureau report, New Home Sales in May were at a seasonally adjusted annual rate of 1.234 million. April's sales were revised down to 1.180 million.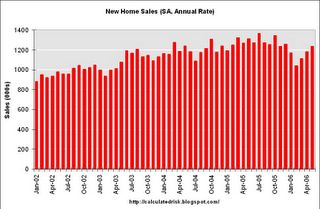
Click on Graph for larger image.
Sales of new one-family houses in May 2006 were at a seasonally adjusted annual rate of 1,234,000 ... This is 4.6 percent above the revised April rate of 1,180,000, but is 5.9 percent below the May 2005 estimate of 1,311,000.

The Not Seasonally Adjusted monthly rate was 114,000 New Homes sold. There were 120,000 New Homes sold in April 2005.
On a year over year basis, April 2006 sales were 5.0% lower than April 2005. Also, April '06 sales were about 1% below April '04.
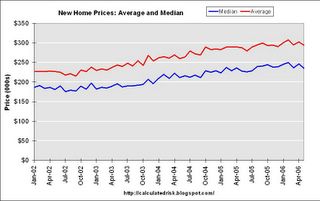
The median and average sales prices were down slightly. Caution should be used when analyzing monthly price changes since prices are heavily revised.
The median sales price of new houses sold in May 2006 was $235,300; the average sales price was $294,300.
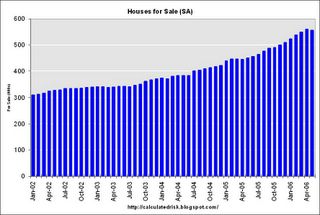
The seasonally adjusted estimate of new houses for sale at the end of May was 556,000. This represents a supply of 5.5 months at the current sales rate.
The 556,000 units of inventory is slightly below the record for new houses for sale set in April.
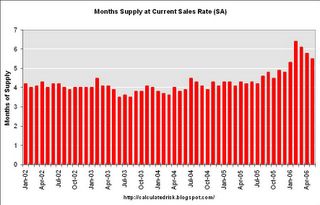
On a months of supply basis, inventory is above the level of recent years.
This report is stronger than expected and will probably be revised down (like the previous months).
This report indicates the housing slowdown is orderly - so far.
Friday, June 23, 2006
Hank Paulson Riddle Solved!
by Calculated Risk on 6/23/2006 05:05:00 PM
Earlier this year, Daniel Gross wrote for Slate: Why no Wall Street CEO wants to be the new Treasury secretary.
John Snow will have a replacement, and he may very well come from the corporate world. But if it's an A-list Wall Street CEO, I'll buy a copy of Dow 36,000 and eat the first chapter.After the nomination of Paulson, Gross wrote: I made a stupid promise. And now I have to keep it.
"... to the delight of Slate's New York bureau, a luncheon of Dow 36,000 and field greens, drizzled (well, drowned) with balsamic vinaigrette, was served. See the video"But why did an 'A-list Wall Street CEO' take the job? The Economist claims: Riddle Solved
When his appointment was announced, Mr Paulson explained that he was motivated by the “honour” of service. Doubtless he was...I'm sure Mr. Paulson took the job for other reasons, but for someone with so much of their net worth in one company stock, this is a nice method to diversify your holdings.
...
It turns out that for someone, like Mr Paulson, who has lots of shares in one company, becoming treasury secretary comes with a whopper of a tax benefit. ... he may have wanted to diversify his portfolio a little. ... Becoming treasury secretary, however, allows Mr Paulson to sell his shares without penalty or embarrassment. Sale is required by law: no loss of faith there. And his new job is covered by Section 2634 of the Federal Ethics Laws ... Mr Paulson is able to exchange his holdings in Goldman for various widely diversified investments [without paying any current taxes].
Mr Paulson does not shed his tax obligations entirely—they are carried over to his new investments—but he does not have to realise any gains and can thus postpone payment until he does. He can, in short, diversify without cost ...


