by Calculated Risk on 7/26/2006 09:14:00 AM
Wednesday, July 26, 2006
MBA: Mortgage Application Volume Declines
The Mortgage Bankers Association (MBA) reports: Application Volume Declines Slightly
Click on graph for larger image.
The Market Composite Index, a measure of mortgage loan application volume, was 533.8, a decrease of 1.3 percent on a seasonally adjusted basis from 540.8 one week earlier. On an unadjusted basis, the Index decreased 1.2 percent compared with the previous week but was down 28.2 percent compared with the same week one year earlier.Mortgage rates decreased:
The seasonally-adjusted Purchase Index decreased by 2.4 percent to 389.0 from 398.5 the previous week and the Refinance Index increased by 0.6 percent to 1385.2 from 1377.6 one week earlier.
The average contract interest rate for 30-year fixed-rate mortgages decreased to 6.69 percent from 6.73 percent...Change in mortgage applications from one year ago (from Dow Jones):
The average contract interest rate for one-year ARMs decreased to 6.25 percent from 6.28 percent ...
| Total | -28.2% |
| Purchase | -19.0% |
| Refi | -40.3% |
| Fixed-Rate | -27.3% |
| ARM | -30.2% |
The MBA also noted:
The seasonally adjusted Purchase Index ties the three year low that was observed five weeks ago.
Purchase activity is off 19.0% compared to the same week last year. This may be the beginning of
Tuesday, July 25, 2006
Foreclosure filings in Mass. jump 66%
by Calculated Risk on 7/25/2006 10:27:00 AM
The Boston Globe reports: Foreclosure filings in Mass. jump 66%
Foreclosure filings in Massachusetts increased 66 percent in the second quarter, according to data released yesterday, a trend that is expected to continue over the next year.
Mortgage lenders filed 4,292 notices of foreclosure against homeowners during the second quarter, up from 2,585 a year earlier, according to ForeclosuresMass Corp., which compiles the data from Massachusetts Land Court. That 66 percent surge in filings compares with a 30 percent rise in first-quarter filings.
The state's rate of past-due mortgages -- the number of homeowners more than 30 days behind in their payments, as a percent of total mortgages -- is 3 percent, compared with 4 percent nationwide, according to the Mortgage Bankers Association. Lenders have filed for foreclosure on 0.6 percent of Massachusetts mortgages, below the 1 percent national rate.
But, Jeremy Shapiro, the president of ForeclosuresMass, said he was alarmed about the pace of Massachusetts' sharp recent increases.
``The foreclosures in Massachusetts right now are skyrocketing," he said. ``This is a problem that's going to extend through 2007 and 2008."
NAR: Existing-Home Sales Flattening, Prices Cooling
by Calculated Risk on 7/25/2006 09:44:00 AM
The National Association of Realtors (NAR) reports: Existing-Home Sales Flattening, Prices Cooling 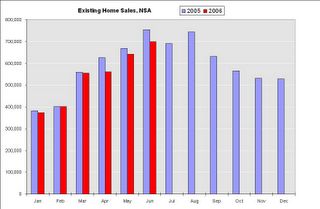
Click on graph for larger image.
Existing-home sales were down modestly in June, and home prices were up slightly from a year ago, according to the National Association of Realtors®.
Total existing-home sales – including single-family, townhomes, condominiums and co-ops – declined 1.3 percent to a seasonally adjusted annual rate1 of 6.62 million units in June from an upwardly revised level of 6.71 million May. Last month’s sales were 8.9 percent below the 7.27 million-unit pace in June 2005.
David Lereah, NAR’s chief economist, said the housing market is flattening-out. “Over the last three months home sales have held in a narrow range, easing to a level that is near our annual projection, which tells us the market is stabilizing,” he said. “At the same time, sellers have recognized that they need to be more competitive in their pricing given the rise in housing inventories. Home prices are only a little higher than a year ago.”
The national median existing-home price2 for all housing types was $231,000 in June, up 0.9 percent from June 2005 when the median was $229,000. The median is a typical market price where half of the homes sold for more and half sold for less.
“The change in price performance is directly tied to housing inventories – a year ago we had a lean supply of homes and a sellers’ market, with monthly home sales at an all-time record high,” Lereah said.
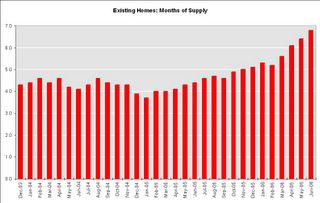
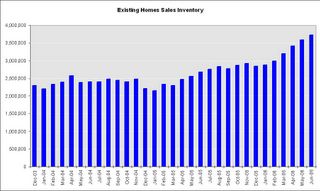
Total housing inventory levels rose 3.8 percent at the end of June to 3.73 million existing homes available for sale, which represents a 6.8-month supply at the current sales pace. By contrast, in June 2005, there was a tight 4.4-month supply on the market.Existing Home Sales are a trailing indicator. The sales are reported at close of escrow, so June sales reflects agreements reached in April and May.
As I've noted before, usually 6 to 8 months of inventory starts causing pricing problem - and over 8 months a significant problem. Current inventory levels, at 6.8 months of supply, are now in the danger zone.
Monday, July 24, 2006
FDIC: Breaking New Ground in U.S. Mortgage Lending
by Calculated Risk on 7/24/2006 03:39:00 PM
From the FDIC Summer Outlook 2006:
[Mortgage lending] growth has not come without risk. Widespread marketing of nontraditional products could be raising the risk profile of some mortgage lenders and consumers. Growing unease about risk taking by lenders and consumers recently led bank regulators to propose new supervisory guidelines on risks of, and disclosures for, various mortgage products.Looking at the first chart, it appears the boom happened during a period of historically low interest rates and a rapid increase in non-prime lending.
This article examines historical developments in mortgage loan volume and underwriting trends. It also assesses the significance of recent market and institutional innovations in light of historical trends, reviews mortgage loan performance trends, discusses the role of regulation, and considers the near-term outlook for the mortgage lending cycle.

Since 2003, strong home price appreciation and declining affordability have helped drive growing demand for nontraditional mortgage products that can be used to stretch home-buying power. Aided by new computer models and an easing in lending standards, many lenders have accommodated this demand by expanding
the variety of nontraditional mortgage products offered while also extending loans to borrowers with less-than stellar credit histories. As a result, by 2005, nonprime
lending, comprised of subprime and Alt-A (low- or nodocumentation) loans, accounted for about 33 percent of all mortgage loan originations, up from almost 11 percent in 2003.
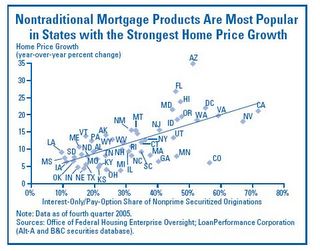
Rapid growth also has occurred among some of the higher-risk mortgage alternatives within the nonprime arena. As recently as 2002, IOs and pay-option ARMsThere is much more in the FDIC outlook.
represented only 3 percent of total nonprime mortgage originations that were securitized. However, the IO share of credit to nonprime borrowers has soared during the past two years to 30 percent of securitized nonprime mortgages, while the pay-option product jumped to a similar share in less time (see Chart).
Furthermore, the low- or no-documentation share of subprime lending has grown significantly since 2001, from about 25 percent to just over 40 percent.
Saturday, July 22, 2006
Putting off the Mortgage Pain, Until ...
by Calculated Risk on 7/22/2006 08:51:00 PM
These two articles fit together - first, from the NY Times: Re-refinancing, and Putting Off Mortgage Pain
It is the latest twist in the gravity-defying world of the high housing prices and exotic low-rate mortgages: As monthly payments on adjustable-rate mortgages are starting to balloon, many Americans have found a way to put off the day of reckoning.And from the WSJ: New Headache For Homeowners: Inflated Appraisals
They are refinancing with new adjustable-rate mortgages that keep monthly payments low — for now, that is, though their payments are likely to rise even higher in the future.
"Now it's pay-the-piper time for people, and they're finding out they don't have the value in the house they thought they had," says John Taylor, president of the National Community Reinvestment Coalition, a Washington-based nonprofit that supports low-income housing.And back to the NY Times:
Karen Ammon, who works for an auto-parts marketing company in Bloomfield Hills, Mich., bought her home in 2002 for $141,000. A year later, a lender encouraged her to refinance into a larger loan that would let her pay off credit-card debt. The appraiser chosen by the lender had great news: Her house was now valued at $175,000. She had room to raise her total mortgage borrowings to $165,000.
Now monthly payments on the adjustable-rate loan she received in 2003 are rising in line with the general level of interest rates. So Ms. Ammon wants to refinance into a fixed-rate loan. But when she tried to refinance, she couldn't do so because several appraisers valued her home at around $148,000 -- or about $15,000 less than she owes in mortgage debt.
For now, this mini-refinancing boom is assuaging fears that rising interest rates and higher monthly payments would drive some borrowers into foreclosure or force them to scale back sharply on other spending. As a result, consumer spending may hold up better than some economists had thought.I expect that most homeowners will "put off the day of reckoning" for as long as possible. The result, for the housing market, is each year another group of homeowners will find themselves upside down and desperately need to sell.
But the refinancing also represents a doubling-down on a bet that housing prices will continue to rise on the West and East Coasts and in other hot markets. If the value of the home falls closer to the amount of the loan, that could curb the ability to refinance, and may prompt the homeowner to either invest more in the home or to sell it.
Instead of a surge of inventory over just a year or two due to balloning payments, homeowners will refinance, if they can, and there will be a steady supply of inventory over several years - prolonging the housing bust.
WSJ: For-Sale Signs Multiply, Prices Slip
by Calculated Risk on 7/22/2006 12:17:00 AM
The WSJ reports: For-Sale Signs Multiply Across U.S. As Supplies Rise and Prices Slip
The housing market continues to weaken in much of the country as inventories of unsold homes rise and many sellers cut their asking prices, a quarterly survey by The Wall Street Journal shows.Prices "edging down" is exactly what I expect - not a "broad collapse of housing prices". I also expect inventories to continue to rise.
There is no sign of a broad collapse of housing prices about a year after the once-hot coastal markets entered a long-anticipated cooling phase. But the general level of prices is edging down in some areas and leveling off in others, while the supply of homes for sale keeps rising.
Source: WSJ Online
"I do think we're going to see some tougher times ahead," says Scott Anderson, senior economist at Wells Fargo & Co. in Minneapolis. By August, he says, most cities in California will be showing modest declines from a year earlier in home prices, and prices also may decline further in parts of Florida, Nevada, Arizona and the Northeast.The language has definitely changed. The chief economist for CAR no longer feels comfortable with the term "soft landing" and now the Wells Fargo senior economist is talking about the market stabilizing in "late 2007".
Headlines about falling prices could make buyers more aggressive in negotiating and persuade some sellers to "get out with what they can," Mr. Anderson says.
Mr. Anderson expects the current downswing to last into next year; by late 2007, he thinks the market will be stabilizing.
Friday, July 21, 2006
California: Housing Sales off 16% from 2005
by Calculated Risk on 7/21/2006 02:58:00 PM
DataQuick reported total California June Home Sales.
"A total of 53,700 new and resale houses and condos were sold statewide last month. That's up 3.8 percent from 51,750 for May and down 20.7 percent from 67,750 for June 2005."
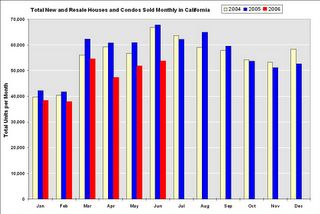
Click on graph for larger image.
Here are the monthly sales in California for the last 3 years (Source: DataQuick)
Sales for 2006 have fallen 15.7% year-to-date compared to 2005.
In the previous post, the LA Times mentioned the current California Association of Realtors (CAR) forecast is for a "16.8% drop" in existing sales. With sales slowing even more over the last 3 months (off almost 20% compared to 2005), that revised prediction might prove to be too optimistic.
California Assn. of Realtors: Not 'Soft Landing'
by Calculated Risk on 7/21/2006 11:38:00 AM
David Streitfeld writes in the LA Times: Housing Expert: 'Soft Landing' Off Mark. Excerpts:
The chief economist of the California Assn. of Realtors has stopped using the term "soft landing" to describe the state's real estate market, saying she no longer feels comfortable with that mild label.On Real Estate agents, just see my previous post!
...
For real estate optimists, the phrase "soft landing" conveyed the soothing notion that the run-up in values over the last few years would be permanent. It wasn't a bubble, it was a new plateau.
The Realtors association last month lowered its 2006 sales prediction from a 2% slip to a 16.8% drop. That was when Appleton-Young first told the San Diego Union-Tribune that she didn't feel comfortable any longer using "soft landing."
...
If there's one group in California still unreservedly bullish on real estate, it might be the throngs lining up to take the licensing exams.
The state Department of Real Estate recently reported that the total number of agents in the state passed 500,000 in May for the first time. That's one agent for every 55 adults in the state.
Appleton-Young had no qualms about predicting a hard landing here: "We're expecting a fairly significant shakeout."
Thursday, July 20, 2006
California: Real Estate Licensees Surpasses 500,000
by Calculated Risk on 7/20/2006 11:55:00 PM
The California Department of Real Estate reports the total number of Real Estate licensees reached 504 thousand in the state at the end of June 2006. This is an increase of 55,000 agents / brokers over the last 12 months.
Click on graph for larger image in new window.
The number of Salesperson licensees has reached 336.7 thousand, a 14% increase over one year ago.
The number of Broker licensees is 137.4 thousand; 8% higher than last year.
The second graph shows the annual growth rate for the number of salesperson and broker licensees.
In California, the number of real estate transactions peaked last year, but the number of licensees continues to grow.
Husing: Soft Landing for Inland Empire Housing
by Calculated Risk on 7/20/2006 07:48:00 PM
Private economist Dr. John Husing is quoted in the San Bernardino Sun: Husing still optimistic
There's just too strong an economy and too much job growth for much other than the "soft landing'' Husing and other economists have been predicting for the end of the five-year housing boom.
"We are right on the cusp of a very powerful period in job growth,'' Husing said. "Local [Inland Empire, San Bernardino/Riverside area] unemployment in May was 4.2 percent, and that's the lowest I have seen for May in 42 years of studying the local economy.
...
Senior economist Christopher Thornberg of UCLA's Anderson School of Management had called the soft-landing theory "nonsense'' on Tuesday and said we are in a "classic bubble.''
"If we are lucky, prices will go flat,'' he said, suggesting that we could see five years without price appreciation.
That may be true elsewhere, Husing said, but it won't happen here.
"Is the housing market vulnerable?'' he asked. "Yes, it is. But is a bubble likely to happen? No, it is not. The underlying strength of our economy is too great.''

Click on graph for larger image.
I disagree with Dr. Husing. I think the Inland Empire is one of the most vulnerable areas to a housing slowdown. Construction is far more important to the San Bernardino/Riverside economy than most other areas of the state.

As the homebuilders start to layoff workers, a larger percentage of workers in the San Bernardino and Riverside area are at risk. During the previous housing bust, the Inland Empire unemployment rate rose from 4.9% to over 12% (NSA) in just three years.
With regards to timing, I noted earlier:
Historically Construction Employment continued to rise for a year or more after the peak in housing transactions.So I expect construction employment in the Inland Empire to start to fall during the next couple of quarters.
UPDATE: DoD Employment as Percent of Nonfarm Employment.

A common question is: how much did the aerospace / DoD spending slowdown in the early '90s impact employment? Although I don't have aerospace data (I'll look), this graph shows DoD employment was far more important for San Diego than the Inland Empire.
DoD and aerospace were probably most important for LA and San Diego in the '90s
Note that DoD employment was far less than construction employment. Also, DoD employment only fell slightly faster than total employment in the early '90s. Construction employment fell sharply. DoD employment was fairly flat during the mid-90s, so the percentage of total employment continued to fall as the California economy added jobs.
Although the aerospace slowdown probably precipitated the general economic slowdown in California during the early '90s, the housing slowdown had a larger impact. This time, many of us are suggesting that the housing slowdown will most likely be the precipitating event.


