by Calculated Risk on 9/25/2006 10:16:00 AM
Monday, September 25, 2006
NAR: Sales Down, Prices Down, Inventory Up
The National Association of Realtors (NAR) reports: Existing-Home Sales Holding At A Sustainable Pace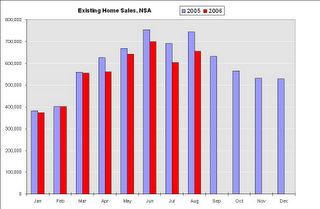
Click on graph for larger image.
Total existing-home sales – including single-family, townhomes, condominiums and co-ops – slipped 0.5 percent to a seasonally adjusted annual rate1 of 6.30 million units in August from a level of 6.33 million Ju1y, and were 12.6 percent lower than the 7.21 million-unit pace in August 2005, which was the second highest on record.
David Lereah, NAR’s chief economist, said home sales appear to be leveling out. “After a stronger-than-expected drop in July, the fairly even sales numbers in August tell us the market is at a more sustainable pace,” he said. “It keeps us on track to see the third highest sales year on record, but we do expect an adjustment in home prices to last several months as we work through a build up in the inventory of homes on the market.”
The national median existing-home price for all housing types was $225,000 in August, down 1.7 percent from August 2005 when the median was $229,000. The median is a typical market price where half of the homes sold for more and half sold for less. “This is the price correction we’ve been expecting – with sales stabilizing, we should go back to positive price growth early next year,” Lereah said.
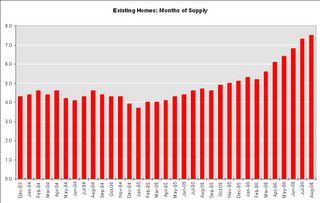
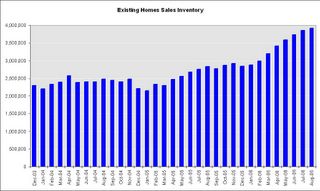
Total housing inventory levels rose 1.5 percent at the end of August to 3.92 million existing homes available for sale, which represents a 7.5-month supply at the current sales pace – the highest supply since April 1993.Existing Home Sales are a trailing indicator. The sales are reported at close of escrow, so August sales reflects agreements reached in June and July.
As I've noted before, usually 6 to 8 months of inventory starts causing pricing problem - and over 8 months a significant problem. With current inventory levels at 7.5 months of supply, inventories are now well into the danger zone and prices are falling in most regions.
BusinessWeek on Mortgage Loan Buybacks
by Calculated Risk on 9/25/2006 01:01:00 AM
From BusinessWeek: Bad Blood Over Bad Loans
Mortgage-backed securities issuance soared from $184.5 billion in 2000 to nearly $1 trillion in 2005, generating more than $1 billion in fees last year.The article lists some of the lenders buying back loans: H&R BLock, NetBank and Fremont.
But now that the real estate tide is ebbing, trash is starting to wash up on shore. Mortgage delinquencies are zooming ...
In some cases, the original lenders are taking the biggest hits. In typical deals, banks agree to buy mortgages back from Wall Street in the case of a payment default within the first 90 days. Now some are writing big checks. ...
A few lenders have refused to buy back loans, prompting arbitrations and lawsuits. Bear, Stearns & Co.'s (BSC ) mortgage affiliate, EMC Mortgage Corp. of Irving, Tex., is suing New York lender MortgageIT over $70.5 million in disputed buybacks. ... And Lehman Brothers Inc. (LEH ) is trying to recoup $20 million on toxic loans bought years ago from Beverly Hills Estates Funding Inc., whose principal, Charles Elliott Fitzgerald, is believed to have fled the country to a South Pacific island.And this is probably just the beginning.
Sunday, September 24, 2006
More Builder Incentives
by Calculated Risk on 9/24/2006 11:40:00 PM
Horton hears a ... bust? Click on Ad for larger image.
From the Daytona Beach News advertising section:
How about 30% off the list price? And a free washer, dryer and refrigerator?
Realtors Warmly Welcomed. I bet they are!
A few more: Eagle Homes' ad reads "no money down" and "no mortgage payments for 6 months".
ICI Homes advertises "Up to $50,000 Off" and, as a "special thank you ICI Homes will pay your closing costs".
Mortgage Extraction and the Trade Deficit
by Calculated Risk on 9/24/2006 01:01:00 AM
In the previous post, I graphed GDP growth, with and without mortgage equity withdrawal (MEW), for the last 30 years. Now for a little good news.
Note: the previous post also reviewed the record low equity percentage in household real estate - even though the U.S. housing market has seen significant appreciation.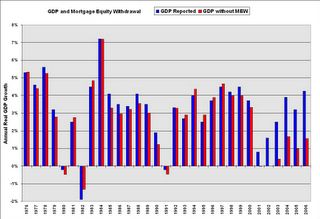 Click on graph for larger image.
This is graph 2 from the previus post and shows real annual GDP growth, with and without MEW, for the last 30 years.
One of the key assumptions is that MEW related consumption is of domestic products and services. Any MEW related consumption of imports does not impact GDP.
Let's review the components of Gross Domestic Product (GDP):
GDP = Consumption (PCE) + Investment + Trade Balance + Government Spending.
So if consumption rises $30 Billion due to MEW, but all of that consumption is of imported products and services (reducing the trade balance by $30 Billion), GDP is not impacted. And there appears to be a correlation between MEW and the trade deficit. Alan Greenspan commented on this relationship in Feb of 2005:
"Interestingly, the change in U.S. home mortgage debt over the past half-century correlates significantly with our current account deficit. To be sure, correlation is not causation, and there have been many influences on both mortgage debt and the current account."The following graph uses MEW (instead of the increases in the mortgage debt) and the trade balance (instead of the current account balance). MEW is probably better than the overall increase in mortgage debt - because much of the increase in mortgage debt is due to residential investment and is not available for consumption.
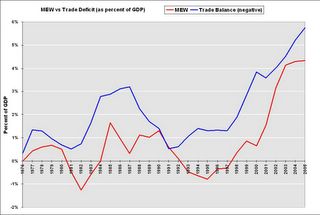 Note: The trade balance is inverted since MEW would increase the trade deficit.
MEW and the trade deficit, as a percent of GDP, have tracked each other with a high correlation over the last 30 years. As Greenspan noted correlation is not causation.
However a possible explanation for this correlation is that a disproportionate percentage of MEW, as compared to normal consumption patterns, flows to imports as opposed to consumption of domestic products and services.
This means that the impact of MEW on GDP would be less than in graph 1. That is the good news.
However this would imply potential bad news for U.S. trading partners if MEW continues to decline as expected. And there is a possible impact on interest rates (bad for housing) that I will discuss soon
Friday, September 22, 2006
GDP Growth: With and Without Mortgage Extraction
by Calculated Risk on 9/22/2006 05:35:00 PM
UPDATE: Please see the next post on why MEW that flows to imports wouldn't impact GDP as in graph 2.
The recent Flow of Funds report showed that household mortgages increased $220.3 Billion in Q2 2006, and $436.4 Billion for the first half of 2006. Using a simple formulation(1) for Mortgage Equity Withdrawal (MEW), MEW was $81.6 Billion in Q2 2006. This is substantially below the record $180.1 Billion of MEW in Q3 2005. Click on graph for larger image.
The first graph shows quarterly MEW as a percent of GDP for the last 30 years. There is substantial quarterly variability in MEW, but it appears MEW has fallen, as a percent of GDP, from the levels of the last few years. Using Greenspan's estimate of approximately 50% of MEW flowing through to personal consumption expenditures, it is possible to estimate the impact of MEW on GDP.
This graph, of annual real GDP growth for the last 30 years, clearly shows the unprecedented impact of MEW over the last few years.
(2006: first two quarters)
Using this method, the surge in MEW in the mid to late '80s boosted GDP by an average of about 0.5% per year. Over the last five years, MEW has boosted GDP by an average of 2.2% per year!
UPDATE NOTE: The above calculations and graph assumes that consumption is domestic. In reality a large portion of MEW related consumption probably flows to imports. I'll write more about this.
NOTE: Although this analysis matches MEW to GDP in the quarter the equity was extracted, there is probably a lag from extraction to consumption expenditures. As an example, someone might borrow money in Q4 and buy a new car in Q1 of the following year. So the strong equity extraction at the end of 2005 probably boosted GDP in Q1 2006.
Maybe 50% flowing through to consumption is too high, but the relative impact would be the same. And notice what happened in the early to mid 90s; MEW was negative and was a drag on consumption and GDP. MEW will probably be a drag on GDP for several years in the near future - maybe starting in 2007. The final graph shows the percentage of equity in household real estate. Currently households have a record low 54.1% equity in their homes.
That may sound like a high percentage of equity, but according to Robert Broeksmit, Chairman of the Residential Board of Governors, Mortgage Bankers Association (from the Senate hearing on Wednesday):
"More than a third of homeowners, approximately 34 percent, own their homes free and clear."This group is probably risk adverse and it's unlikely they will borrow significantly on their homes to fuel consumption. So the debt burden falls on the other 66%.
On the third graph, notice that the percent equity dropped significantly from 1990 to 1996 - during the early '90s housing bust - even though MEW turned negative.
 The fourth graph shows what happened during the '90s bust: the value of household real estate to GDP declined for several years, while the growth of mortgage debt kept pace with GDP growth. This lead to a significant decline in homeowners percentage of equity.
From early 1990 to 1996, the percent equity declined from 65% to 58%. Currently the percent equity is at a record low 54.1%. If something similar happens as in the early '90s, the percent equity could easily drop into the high 40% range in the next few years - and remember - that includes the 34% of homeowners with no debt.
This analysis leads me to believe that declining MEW over the next few years will be a significant drag on GDP growth.
Note 1: to calculate MEW, I subtracted 70% of residential investment (RI) from the increase in household mortgages. This is an approximation for identifying and excluding all mortgage debt for New Home purchases and home improvements. The reason I used 70% was a portion of RI is not borrowed, and a portion of RI is for apartments. This is not exact, but it is close.
Rate Cut Probabilities Rise
by Calculated Risk on 9/22/2006 02:32:00 PM
Every day the Cleveland Fed calculates the future Fed Funds Rate probabilities based on current market expectations.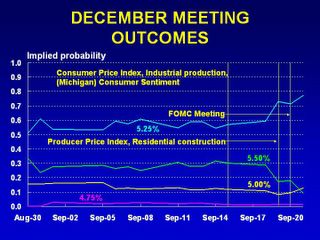 Click on graph for larger image.
The Fed Funds Futures are indicating a pause at both the October and December FOMC meetings.
However, market expectations for a rate cut are now higher than expectations for an increase in December.
Perhaps the economy is slowing quicker than many obervers expected. Professor Roubini sure thinks so: U.S. Hard Landing And Recession Steaming Ahead: Now More Likely than a 70% Probability! See Roubini point 5:
5. The Fed will not just pause but stop hiking and then cut rates in the winter (by December or at the latest February). Markets were way behind the curve in their assessment of Fed policy as they were still debating the next hike rather than discussing when the Fed would ease.
Senate Hearing Video
by Calculated Risk on 9/22/2006 11:52:00 AM
Paper-Money has posted the video for the Senate Panel hearing: Assessing Non-Traditional Mortgage Products.
Thursday, September 21, 2006
Hot New Toy?
by Calculated Risk on 9/21/2006 11:24:00 PM
For something a little different, I've heard TMX Elmo is off the charts HOT and is already sold out. Here is the EBay page.
Senate Hearing Audio: Nontraditional Mortgages
by Calculated Risk on 9/21/2006 04:07:00 PM
The complete audio (panels 1 and 2) is here.
Note: the second panel starts at 1 hour 30 minutes into the 3 hour audio.
Morgan Stanley's Berner: The Great Housing Debate
by Calculated Risk on 9/21/2006 02:50:00 PM
Economist Richard Berner believes the housing bust will have less of an impact on the economy than many observers expect. From Berner:
US housing activity is in recession and home prices are decelerating sharply, and those trends likely will intensify. The combination could pare as much as 1½ percentage points from US growth in the second half of 2006, and many are thus concluding that the economy is headed for trouble. We continue to think that there are significant offsets to these drags on economic activity, such as stronger global growth and declining energy quotes. As a result, the prognosis for growth could be stronger than either pessimists or market participants expect (see "Is This What A Soft Landing Feels Like?" Global Economic Forum, September 5, 2006). [emphasis added]Berner comments on the weakness in the housing market, but he believes real prices will not fall significantly:
We’re bearish on housing activity and think the deceleration in prices has further to go. ...That may sound bearish, but Berner is painting a soft landing picture. Berner then addresses mortgage equity extraction and he believes the concerns are overblown:
The pessimists argue that the bursting of a putative housing bubble means that prices could decline significantly. There is some risk that prices could decelerate faster or even decline in real terms — after all, investment and speculative activity has picked up in the past five years. But the character of housing demand makes the much-feared decline in prices on a nationwide basis unlikely ...
Nonetheless, prices may fall in markets that are affected by a weak economy (e.g., Detroit), by high speculative activity (e.g., some condominium markets) or where there is a preponderance of second homes (e.g., in Florida or the Sunbelt). ...
However, the recession in housing activity is a nationwide development and will significantly depress growth. We estimate that the decline in 1-family housing starts directly will cut 0.9 percentage point from US real growth in the second half of 2006 (single-family construction amounts to about 3.3% of GDP; we expect that apartment construction will improve somewhat after eight years of no growth, which has limited supply and helped rents to firm). The plunge in single-family housing construction will cost both output and jobs. We expect that the loss of jobs in residential construction, real estate brokerage, and mortgage finance could amount to 10,000 monthly. ...
Of course, that’s not all. The decline in housing demand probably will crimp spending on furniture, appliances and other household goods ... A 10% decline in such outlays over a year could knock another 0.3% off overall GDP.
...it would be reasonable to think that the surge in housing wealth and home equity extraction has fueled significant spending gains in these discretionary items, that households can postpone such purchases, and that even a deceleration in housing wealth could promote declines in these big-ticket outlays.This is a soft landing scenario.
Reasonable, yes, but not entirely accurate. First, housing activity and big-ticket housing-related durables don’t necessarily march in lockstep anymore. ...
Moreover, and most important, in my view the deceleration in housing wealth will have at most one-fifth the impact on consumer spending that some fear. Some, including former Fed Chairman Greenspan, believe that 50 cents of every additional dollar of home equity extraction has financed consumer outlays. Empirical studies, however, suggest that a $1 decline in real housing wealth would trim spending by at most 11 cents, and some suggest that the effect would be half that magnitude (see “Housing Wealth and Consumer Spending” and “Housing, Mortgages and Consumption: Comparing Australia, the UK and the US,” Global Economic Forum, October 7, 2005 and March 2, 2006, respectively). Of course, that’s not negligible; we estimate that the flattening in real housing wealth in our outlook will pare roughly ½ percentage point from the growth in consumer outlays over the coming year.
I disagree with Berner on several points. I think real prices will fall nationwide, both in nominal and real terms. This is an important difference: first, I believe the psychological impact of falling prices will exacerbate the housing bust, and second, falling prices will have a larger impact on borrowers that have used nontraditional loans as affordability products (Berner didn't address the exotic loan issue). I will address Berner's comments on the impact of mortgage extraction in another post.


