by Calculated Risk on 9/26/2006 12:01:00 PM
Tuesday, September 26, 2006
LA Times: Data on Homes Cause Jitters
The LA Times covers several housing topics in this article: Data on Homes Cause Jitters. Some excerpts:
... the real estate boom of the last decade has been unprecedented in size and scope, which raises the risk that the downside also could exceed forecasters' best guesses, said Eric Belsky, executive director of Harvard University's Joint Center for Housing Studies.Employment tends to lag, and so far housing related employment has only fallen slightly according to the BLS.
After any boom, "there's a tendency to predict a more gradual unwinding than actually occurs," he said.
Housing's troubles pose two main threats: one to millions of jobs directly dependent on the business, the other to homeowners' willingness and ability to spend if they feel poorer because of the trend in property prices.
About 10 million jobs are tied directly to residential real estate, from construction workers to escrow agents to the clerks at the local hardware store, Goldman Sachs estimates. That's about 7% of total U.S. employment. Some analysts believe the total is closer to 10%.
... employment cuts overall have been modest, at least as measured by government payroll data, which don't pick up freelance workers. Payroll jobs in residential construction totaled 3.31 million in August, off just fractionally from the 3.33 million at the start of the year, Labor Department data show.And on MEW:
Andy Perkins, San Diego branch manager for Orco Construction Supply, said he believed that job losses were just beginning as housing projects finish up and builders find little or no new demand.
...
Goldman Sachs estimates that the housing sector nationwide could shed 1.5 million to 2 million jobs over the next several years as the industry retrenches.
There also is the so-called wealth effect that housing prices have on consumers' spending.Using my method for calculating MEW, there was $504 Billion in 2004 (compared to Greenspan's estimate of $600 Billion). Although my method is conservative, it is the decrease in MEW that will impact consumer spending - and MEW appears to be decreasing in 2006.
Rocketing home prices over the last decade provided many Americans with an income windfall, either from the outright sales of houses at a profit or from mortgage refinancings or credit lines that allowed homeowners to cash in some of their accumulated equity.
A study coauthored by then-Federal Reserve Chairman Alan Greenspan last year estimated that mortgage-equity withdrawals tied to surging real estate values added $600 billion to consumers' disposable income in 2004 alone, making up about 7% of the total that year.
The LA Times article does a good job of discussing the first two impacts from the housing bust: lost housing related jobs, and the loss of MEW and the potential impact on consumer spending. This article does not discuss the impact from excessive leverage (and foreclosures) using nontraditional loans.
Volcker Sees Inflation Risks
by Calculated Risk on 9/26/2006 01:40:00 AM
From Bloomberg: Volcker Sees Risks of U.S. Inflation Creep, Pressure on Fed
Paul Volcker ... said he's worried both about inflation and pressure on the U.S. central bank to not do anything about it.
"I am a little bit more worried about inflation," said Volcker, 79, speaking at a discussion sponsored by the Women's Economic Round Table in New York yesterday. Gerald Corrigan, who served as New York Fed president from 1985 to 1993, said he shared Volcker's concerns.
While the inflation rate isn't "high" or "running away," Volcker said, "it is kind of creeping up, and I am impressed by the degree of pressure, if that is the right word -- psychological pressure, political pressure -- there is not to do anything about it."
Click image for video.
And this fits in with Dr. Tim Duy's Fed Watch tonight: Widening Disconnect
The countdown to the next FOMC meeting is underway, and the gap between market expectations and the Fedspeak appears to be widening. Quite honestly, I find such periods very, very uncomfortable, mostly because I feel Fed watching amounts to explaining a position taken by the Federal Reserve that the markets believe is increasingly untenable.
Monday, September 25, 2006
CAR: Existing Home Sales decrease 30.1%
by Calculated Risk on 9/25/2006 07:03:00 PM
The California Association of Realtors reports: C.A.R. reports sales decrease 30.1 percent in August, median price of a home in California at $576,360, up 1.6 percent from year ago
Home sales decreased 30.1 percent in August in California compared with the same period a year ago, while the median price of an existing home increased 1.6 percent ...According to NAR, nationwide existing home sales are off 12.6%, compared to 30.1% for California, since August 2005.
"We experienced the greatest year-to-year sales decline last month since August 1982, when sales fell 30.4 percent," said C.A.R. President Vince Malta....
Closed escrow sales of existing, single-family detached homes in California totaled 442,150 in August at a seasonally adjusted annualized rate... Statewide home resale activity decreased 30.1 percent from the 632,240 sales pace recorded in August 2005.
...
The median price of an existing, single-family detached home in California during August 2006 was $576,360, a 1.6 percent increase over the revised $567,320 median for August 2005 ... The August 2006 median price increased 1.7 percent compared with July’s revised $566,940 median price.
"Although the median price in the state and in several regions hit an all-time record in August, we expect softer prices toward the end of the year," said C.A.R. Vice President and Chief Economist Leslie Appleton-Young. ...
C.A.R.’s Unsold Inventory Index for existing, single-family detached homes in August 2006 was 6.8 months, compared with 2.6 months (revised) for the same period a year ago.
In a separate report covering more localized statistics generated by C.A.R. and DataQuick Information Systems, 61.7 percent, or 246 out of 399 cities and communities showed an increase in their respective median home prices from a year ago. DataQuick statistics are based on county records data rather than MLS information.
California's sales decrease accounts for over 20% of the U.S. sales decrease since last August. Yet California still has slightly less inventory on a month of sales basis: 6.8 months vs. 7.5 months for U.S. That is probably why median prices in California have held up slightly better than for the U.S.
I live in California, and everyone I talk with in the real estate business believes prices are falling ... and falling significantly in some areas like Sacramento and San Diego. It's not a good sign that California is holding up the U.S. statistics. I believe that will change soon.
NAR: Sales Down, Prices Down, Inventory Up
by Calculated Risk on 9/25/2006 10:16:00 AM
The National Association of Realtors (NAR) reports: Existing-Home Sales Holding At A Sustainable Pace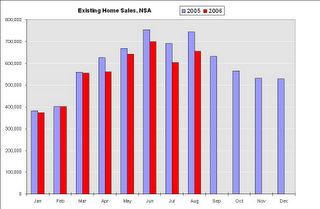
Click on graph for larger image.
Total existing-home sales – including single-family, townhomes, condominiums and co-ops – slipped 0.5 percent to a seasonally adjusted annual rate1 of 6.30 million units in August from a level of 6.33 million Ju1y, and were 12.6 percent lower than the 7.21 million-unit pace in August 2005, which was the second highest on record.
David Lereah, NAR’s chief economist, said home sales appear to be leveling out. “After a stronger-than-expected drop in July, the fairly even sales numbers in August tell us the market is at a more sustainable pace,” he said. “It keeps us on track to see the third highest sales year on record, but we do expect an adjustment in home prices to last several months as we work through a build up in the inventory of homes on the market.”
The national median existing-home price for all housing types was $225,000 in August, down 1.7 percent from August 2005 when the median was $229,000. The median is a typical market price where half of the homes sold for more and half sold for less. “This is the price correction we’ve been expecting – with sales stabilizing, we should go back to positive price growth early next year,” Lereah said.
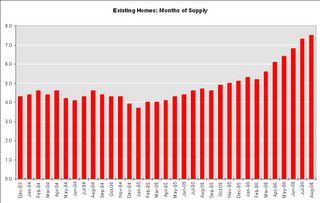
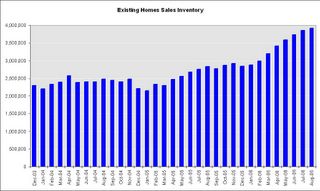
Total housing inventory levels rose 1.5 percent at the end of August to 3.92 million existing homes available for sale, which represents a 7.5-month supply at the current sales pace – the highest supply since April 1993.Existing Home Sales are a trailing indicator. The sales are reported at close of escrow, so August sales reflects agreements reached in June and July.
As I've noted before, usually 6 to 8 months of inventory starts causing pricing problem - and over 8 months a significant problem. With current inventory levels at 7.5 months of supply, inventories are now well into the danger zone and prices are falling in most regions.
BusinessWeek on Mortgage Loan Buybacks
by Calculated Risk on 9/25/2006 01:01:00 AM
From BusinessWeek: Bad Blood Over Bad Loans
Mortgage-backed securities issuance soared from $184.5 billion in 2000 to nearly $1 trillion in 2005, generating more than $1 billion in fees last year.The article lists some of the lenders buying back loans: H&R BLock, NetBank and Fremont.
But now that the real estate tide is ebbing, trash is starting to wash up on shore. Mortgage delinquencies are zooming ...
In some cases, the original lenders are taking the biggest hits. In typical deals, banks agree to buy mortgages back from Wall Street in the case of a payment default within the first 90 days. Now some are writing big checks. ...
A few lenders have refused to buy back loans, prompting arbitrations and lawsuits. Bear, Stearns & Co.'s (BSC ) mortgage affiliate, EMC Mortgage Corp. of Irving, Tex., is suing New York lender MortgageIT over $70.5 million in disputed buybacks. ... And Lehman Brothers Inc. (LEH ) is trying to recoup $20 million on toxic loans bought years ago from Beverly Hills Estates Funding Inc., whose principal, Charles Elliott Fitzgerald, is believed to have fled the country to a South Pacific island.And this is probably just the beginning.
Sunday, September 24, 2006
More Builder Incentives
by Calculated Risk on 9/24/2006 11:40:00 PM
Horton hears a ... bust? Click on Ad for larger image.
From the Daytona Beach News advertising section:
How about 30% off the list price? And a free washer, dryer and refrigerator?
Realtors Warmly Welcomed. I bet they are!
A few more: Eagle Homes' ad reads "no money down" and "no mortgage payments for 6 months".
ICI Homes advertises "Up to $50,000 Off" and, as a "special thank you ICI Homes will pay your closing costs".
Mortgage Extraction and the Trade Deficit
by Calculated Risk on 9/24/2006 01:01:00 AM
In the previous post, I graphed GDP growth, with and without mortgage equity withdrawal (MEW), for the last 30 years. Now for a little good news.
Note: the previous post also reviewed the record low equity percentage in household real estate - even though the U.S. housing market has seen significant appreciation.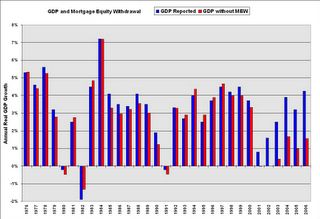 Click on graph for larger image.
This is graph 2 from the previus post and shows real annual GDP growth, with and without MEW, for the last 30 years.
One of the key assumptions is that MEW related consumption is of domestic products and services. Any MEW related consumption of imports does not impact GDP.
Let's review the components of Gross Domestic Product (GDP):
GDP = Consumption (PCE) + Investment + Trade Balance + Government Spending.
So if consumption rises $30 Billion due to MEW, but all of that consumption is of imported products and services (reducing the trade balance by $30 Billion), GDP is not impacted. And there appears to be a correlation between MEW and the trade deficit. Alan Greenspan commented on this relationship in Feb of 2005:
"Interestingly, the change in U.S. home mortgage debt over the past half-century correlates significantly with our current account deficit. To be sure, correlation is not causation, and there have been many influences on both mortgage debt and the current account."The following graph uses MEW (instead of the increases in the mortgage debt) and the trade balance (instead of the current account balance). MEW is probably better than the overall increase in mortgage debt - because much of the increase in mortgage debt is due to residential investment and is not available for consumption.
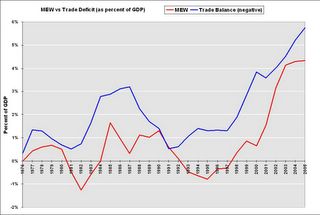 Note: The trade balance is inverted since MEW would increase the trade deficit.
MEW and the trade deficit, as a percent of GDP, have tracked each other with a high correlation over the last 30 years. As Greenspan noted correlation is not causation.
However a possible explanation for this correlation is that a disproportionate percentage of MEW, as compared to normal consumption patterns, flows to imports as opposed to consumption of domestic products and services.
This means that the impact of MEW on GDP would be less than in graph 1. That is the good news.
However this would imply potential bad news for U.S. trading partners if MEW continues to decline as expected. And there is a possible impact on interest rates (bad for housing) that I will discuss soon
Friday, September 22, 2006
GDP Growth: With and Without Mortgage Extraction
by Calculated Risk on 9/22/2006 05:35:00 PM
UPDATE: Please see the next post on why MEW that flows to imports wouldn't impact GDP as in graph 2.
The recent Flow of Funds report showed that household mortgages increased $220.3 Billion in Q2 2006, and $436.4 Billion for the first half of 2006. Using a simple formulation(1) for Mortgage Equity Withdrawal (MEW), MEW was $81.6 Billion in Q2 2006. This is substantially below the record $180.1 Billion of MEW in Q3 2005. Click on graph for larger image.
The first graph shows quarterly MEW as a percent of GDP for the last 30 years. There is substantial quarterly variability in MEW, but it appears MEW has fallen, as a percent of GDP, from the levels of the last few years. Using Greenspan's estimate of approximately 50% of MEW flowing through to personal consumption expenditures, it is possible to estimate the impact of MEW on GDP.
This graph, of annual real GDP growth for the last 30 years, clearly shows the unprecedented impact of MEW over the last few years.
(2006: first two quarters)
Using this method, the surge in MEW in the mid to late '80s boosted GDP by an average of about 0.5% per year. Over the last five years, MEW has boosted GDP by an average of 2.2% per year!
UPDATE NOTE: The above calculations and graph assumes that consumption is domestic. In reality a large portion of MEW related consumption probably flows to imports. I'll write more about this.
NOTE: Although this analysis matches MEW to GDP in the quarter the equity was extracted, there is probably a lag from extraction to consumption expenditures. As an example, someone might borrow money in Q4 and buy a new car in Q1 of the following year. So the strong equity extraction at the end of 2005 probably boosted GDP in Q1 2006.
Maybe 50% flowing through to consumption is too high, but the relative impact would be the same. And notice what happened in the early to mid 90s; MEW was negative and was a drag on consumption and GDP. MEW will probably be a drag on GDP for several years in the near future - maybe starting in 2007. The final graph shows the percentage of equity in household real estate. Currently households have a record low 54.1% equity in their homes.
That may sound like a high percentage of equity, but according to Robert Broeksmit, Chairman of the Residential Board of Governors, Mortgage Bankers Association (from the Senate hearing on Wednesday):
"More than a third of homeowners, approximately 34 percent, own their homes free and clear."This group is probably risk adverse and it's unlikely they will borrow significantly on their homes to fuel consumption. So the debt burden falls on the other 66%.
On the third graph, notice that the percent equity dropped significantly from 1990 to 1996 - during the early '90s housing bust - even though MEW turned negative.
 The fourth graph shows what happened during the '90s bust: the value of household real estate to GDP declined for several years, while the growth of mortgage debt kept pace with GDP growth. This lead to a significant decline in homeowners percentage of equity.
From early 1990 to 1996, the percent equity declined from 65% to 58%. Currently the percent equity is at a record low 54.1%. If something similar happens as in the early '90s, the percent equity could easily drop into the high 40% range in the next few years - and remember - that includes the 34% of homeowners with no debt.
This analysis leads me to believe that declining MEW over the next few years will be a significant drag on GDP growth.
Note 1: to calculate MEW, I subtracted 70% of residential investment (RI) from the increase in household mortgages. This is an approximation for identifying and excluding all mortgage debt for New Home purchases and home improvements. The reason I used 70% was a portion of RI is not borrowed, and a portion of RI is for apartments. This is not exact, but it is close.
Rate Cut Probabilities Rise
by Calculated Risk on 9/22/2006 02:32:00 PM
Every day the Cleveland Fed calculates the future Fed Funds Rate probabilities based on current market expectations.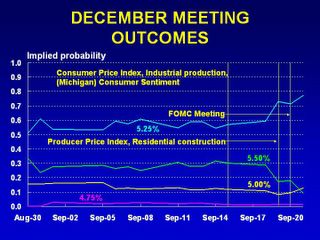 Click on graph for larger image.
The Fed Funds Futures are indicating a pause at both the October and December FOMC meetings.
However, market expectations for a rate cut are now higher than expectations for an increase in December.
Perhaps the economy is slowing quicker than many obervers expected. Professor Roubini sure thinks so: U.S. Hard Landing And Recession Steaming Ahead: Now More Likely than a 70% Probability! See Roubini point 5:
5. The Fed will not just pause but stop hiking and then cut rates in the winter (by December or at the latest February). Markets were way behind the curve in their assessment of Fed policy as they were still debating the next hike rather than discussing when the Fed would ease.
Senate Hearing Video
by Calculated Risk on 9/22/2006 11:52:00 AM
Paper-Money has posted the video for the Senate Panel hearing: Assessing Non-Traditional Mortgage Products.


