by Calculated Risk on 9/28/2006 01:58:00 PM
Thursday, September 28, 2006
UCLA on Housing
The LA Times reports: UCLA Group Predicts Flat Home Prices
... the UCLA Anderson Forecast reiterates earlier projections that the deteriorating housing sector will slow state and national economic output and job growth through 2008. Although it doesn't rule out a recession, it doesn't expect one.In summary, UCLA is forecasting five years of flat nominal home prices (15% to 20% real price decline) and GDP growth of 1.8% through the first half of '07.
...
"Expect home prices five years from now to be about the same as they are today, though lower in real [inflation-adjusted] terms by 15%-20%," the forecast said.
Although the statewide average price might not decline, a few areas where about 40% of the housing stock is new construction — such as in Yolo and Placer counties — are expected to see drops as builders cut prices to move inventory ...
... the lack of a significant price correction is bad for the economy overall because it will lead to further job and productivity losses in the housing sector, said Edward Leamer, director of the UCLA Anderson Forecast.
"So while your happy homeowner is pleased by the fact that home prices are not going down," Leamer said, "the unhappy home builder is not going to have anything to do."
Leamer cautioned that the outlook was based on data trumped by recent reports showing that housing sales and starts were sliding more rapidly than the group had projected.
If the trend accelerates, he said, "then our forecast is too optimistic."
...
It expects inflation-adjusted economic growth to slow to an average annualized rate of 1.8% through the first half of 2007 and unemployment, now at 4.7%, to rise to 5.1% by the end of next year.
...
"While not a recession, it is hardly a pretty picture," the UCLA report said. "The combination of sluggish growth and rising prices will have the look and feel of a low-level stagflation."
Wednesday, September 27, 2006
Dow Jones: Exotic Mortgage Guidance To Be 'Benign'
by Calculated Risk on 9/27/2006 06:56:00 PM
Dow Jones reports: US Government Exotic Mortgage Guidance To Be 'Benign' -Analysts
Federal bank and thrift regulators are close to releasing final guidelines on exotic mortgage products, but the agencies aren't expected to call for wholesale changes in the way these products are marketed or made, three analysts wrote Wednesday.
...
Those guidelines are expected to become final in the next few days.
"We view the...guidance as relatively benign and unlikely to materially impact the business models of option ARM lenders, namely Countrywide (CFC), Washington Mutual (WAMU), Downey Financial (DSL), and Indymac (NDE)," three analysts from Friedman Billings Ramsey wrote in an industry update. [emphasis added]
New Home Sales and Recessions
by Calculated Risk on 9/27/2006 04:35:00 PM
One of the most reliable economic leading indicators is New Home Sales. Click on graph for larger image.
New Home sales were falling prior to every recession of the last 35 years, with the exception of the business investment led recession of 2001. This should raise concerns about a possible consumer led recession in the months ahead.
The second graph shows the YoY change in New Home Sales vs. Recessions. For a description of this graph, see: Investment and Recessions
With the New Home sales data released today, including downward revisions for the last few months, this indicator is at minus 20.6%, a level that has historically signaled a recession. The one exception was in the mid '60s when the buildup for the Vietnam war kept the economy out of recession.
One of the two best economic leading indicators is now flashing recession. The other reliable indicator is an inverted yield curve, and the yield is currently inverted.
More on August New Home Sales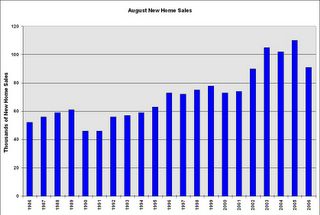 This graph shows August New Home sales for the last 20 years. The recent sharp drop in sales is similar to the decrease at the start of the 1990s housing bust.
August sales have fallen back to the 2002 levels.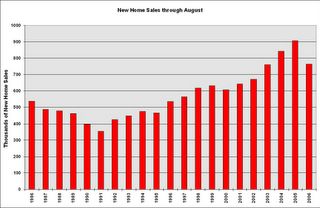
And this graph shows YTD New Home sales through August. It now appears that 2006 will finish as the 4th best year behind 2003.
Given that sales have fallen back to 2002/2003 levels, it would seem reasonable to expect that BLS reported residential construction employment will fall back to the levels of those same years. The following chart shows BLS data for the last 6 years.
| Residential Construction Employment, Monthly Average, Thousands | |||
| Year | Residential building | Residential specialty trade contractors | Total |
| 2001 | 781 | 1849 | 2630 |
| 2002 | 803 | 1887 | 2690 |
| 2003 | 837 | 1965 | 2802 |
| 2004 | 896 | 2123 | 3019 |
| 2005 | 949 | 2278 | 3227 |
| 2006 | 979 | 2346 | 3325 |
There will probably be 600K jobs lost in reported residential construction employment over the next couple of years - if housing stabilizes at this level. If housing continues to fall, something I think is likely, then even more jobs will be lost.
New Home Sales Revisions
by Calculated Risk on 9/27/2006 02:52:00 PM
During periods of housing market weakness, the preliminary estimate of New Home Sales from the Census Bureau has consistently been too high. Click on graph for larger image.
This graph shows the previous 12 months of sales using the preliminary estimate and the final estimate - or most recent estimate for last few months, since final estimate isn't available yet.
NOTE: Graph start at 600 thousand units to better show the difference between the preliminary and final estimates.
During the period of flat sales in 2000 and 2001, the Census Bureau's preliminary estimate was too high. And during the current housing bust, the Bureau's preliminary estimates are once again being revised down.
Today's report was no different. The previous months were all revised down, and the odds are New Home Sales for August will be around or under 1 million units when the final estimate is released.
August New Home Sales: 1.050 Million Annual Rate
by Calculated Risk on 9/27/2006 09:57:00 AM
According to the Census Bureau report, New Home Sales in August were at a seasonally adjusted annual rate of 1.050 million. Sales for July were revised down to 1.009 million, from 1.072 million. Numbers for May and June were also revised down.
Click on Graph for larger image.
Sales of new one-family houses in August 2006 were at a seasonally adjusted annual rate of 1,050,000, ... This is 4.1 percent above the revised July rate of 1,009,000, but is 17.4 percent below the August 2005 estimate of 1,271,000.
The Not Seasonally Adjusted monthly rate was 91,000 New Homes sold. There were 110,000 New Homes sold in August 2005.
On a year over year NSA basis, August 2006 sales were 17.3% lower than August 2005. Also, August '06 sales were below August 2004 (102,000) and August 2003 (105,000) sales. This is the lowest August since 2002 when 90,000 new homes were sold.
The median and average sales prices were down slightly. Caution should be used when analyzing monthly price changes since prices are heavily revised.
The median sales price of new houses sold in August 2006 was $237,000; the average sales price was $304,400.
The seasonally adjusted estimate of new houses for sale at the end of August was 568,000. This represents a supply of 6.6 months at the current sales rate.
The 568,000 units of inventory would have been another record for new houses for sale, except July 2006 was revised up to 570,000.
On a months of supply basis, inventory is above the level of recent years.
This report is very weak, especially considering the strong downward revisions for the previous months.
More later today on New Home Sales and Recessions.
MBA: 30-Year Fixed Rate Declines
by Calculated Risk on 9/27/2006 12:19:00 AM
The Mortgage Bankers Association (MBA) reports: 30-Year Fixed Rate Declines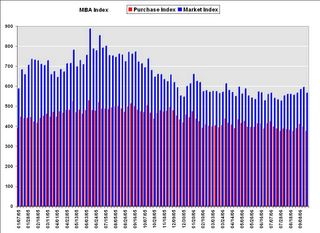 Click on graph for larger image.
The Market Composite Index, a measure of mortgage loan application volume, was 566.5, a decrease of 4.9 percent on a seasonally adjusted basis from 595.8 one week earlier. On an unadjusted basis, the Index decreased 5.4 percent compared with the previous week and was down 21.1 percent compared with the same week one year earlier.Mortgage rates decreased:
The seasonally-adjusted Purchase Index decreased by 5.5 percent to 375.9 from 397.9 the previous week and the Refinance Index decreased by 4.1 percent to 1677.5 from 1748.7 one week earlier. The Purchase Index is at its lowest level since November 2003.
The average contract interest rate for 30-year fixed-rate mortgages decreased to 6.18 percent from 6.36 percent ...
The average contract interest rate for one-year ARMs decreased to 5.90 percent from 5.95 percent ...
 The Purchase Index is at its lowest level since November 2003.
 This graph shows the Purchase Index and the 4 and 12 week moving averages.
Note: Scale does not start at zero to better show changes.
Average year-to-date purchase activity is 13.8% below 2005, and has been running more than 20% below 2005 for the last couple of months.
Tuesday, September 26, 2006
Bernanke's Conundrum
by Calculated Risk on 9/26/2006 07:48:00 PM
Last December I suggested:
I think long rates will start to rise when the Fed starts cutting the Fed Funds rate.First, let's review the relationship between various interest rates and mortgage rates.
This will be Bernanke's "conundrum"! As the economy slows, this will reduce the trade deficit and also lower the amount of foreign dollars willing to invest in the US - the start of a possible vicious cycle.
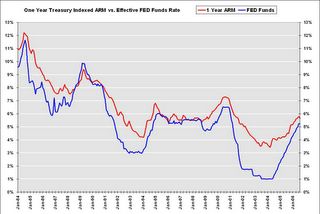 Click on graph for larger image.
One of the most popular mortgages is the One-year Treasury-indexed ARM. When the Fed starts cutting rates, the rate on the one year ARM will probably also decrease. This might help the housing market a little, but ...
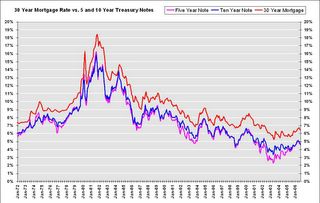
The most popular loans are still the 30 year fixed rate. Typically long rates start falling when the Fed starts cutting rates, but recently there has been a weakening of the link between long and short rates. What if the next time the Fed starts cutting rates, the long rate rises?
NOTE: Although long rates have fallen recently, rates are still well above the lows of the last couple of years.
Via Mark Thoma: Dallas Fed economist Tao Wu wrote about the weakening link, between the Fed Funds rate and long rates, in an economic letter this month: Globalization’s Effect on Interest Rates and the Yield Curve
Monetary policy’s effects on the economy stem largely from how long-term interest rates respond to central banks’ actions. In most industrialized nations, central bankers have direct control over short-term interest rates and use them as their main policy instrument. When central banks raise short-term rates, it usually leads to increases in market-determined long-term rates, including those for mortgages and commercial loans. Higher long-term rates curb aggregate consumption and investment, ultimately helping contain inflation. Cutting short-term rates, on the other hand, usually leads to lower long-term rates, providing a stimulus for economic activity. Any lasting changes in the links between short- and long-term rates will thus have important implications for the timing and impact of monetary policy actions.After a discussion on globalization, Wu concludes:
Central banks’ ability to affect long-term rates may be severely eroded, as we have seen in the recent "conundrum" period.And this takes us to Brad Setser's post today (caution: lots of numbers): The deterioration in the US income balance has just begun .... In the post, Dr. Setser outlines how the trade deficit could fall in '07, but the current account deficit could continue to rise. Many of the details are interesting, but an important conclusion is that long rates could rise even if short rates start to fall.
Consequently, the effects of monetary policy tightening or loosening may be substantially weakened. Because long rates are less sensitive to short rates, the response of aggregate demand to monetary policy moves may prove sluggish. One example is the lack of response in the mortgage and housing markets in 2004 and early 2005, when homebuyers’ borrowing costs changed little as the Federal Reserve tightened. Low rates kept the housing boom in high gear, stimulating sales and providing builders with incentives to expand operations despite the Fed’s attempt to slow the economy.
Globalization’s impact on the relationship between short- and long-term interest rates poses potentially formidable challenges for central banks around the world.
And finally, when might the Fed start to cut rates? According to the Cleveland Fed, market expectations have risen sharply for a rate cut in December (now at 28%):
 Most market participants still expect no action in both October and December, but expectations are definitely rising for a cut in December.
Interestingly this runs counter to recent Fed comments including Paul Volcker's comments yesterday. I recommend (again) Tim Duy's Fed Watch: Widening Disconnect.
So Bernanke might not be deciding between inflation vs. growth. Instead he might face a conundrum with a weakening economy: every time Bernanke cuts rates, long rates might rise (for a year or two). And it's long rates that matter - as Dr. Wu noted:
"Monetary policy’s effects on the economy stem largely from how long-term interest rates respond to central banks’ actions."As always there is the opposite view; several observers are forecasting much lower long rates: PIMCO's Bill Gross and Goldman, Merrill See Bond Rally; 2-Year Yield at 3.6%
LA Times: Data on Homes Cause Jitters
by Calculated Risk on 9/26/2006 12:01:00 PM
The LA Times covers several housing topics in this article: Data on Homes Cause Jitters. Some excerpts:
... the real estate boom of the last decade has been unprecedented in size and scope, which raises the risk that the downside also could exceed forecasters' best guesses, said Eric Belsky, executive director of Harvard University's Joint Center for Housing Studies.Employment tends to lag, and so far housing related employment has only fallen slightly according to the BLS.
After any boom, "there's a tendency to predict a more gradual unwinding than actually occurs," he said.
Housing's troubles pose two main threats: one to millions of jobs directly dependent on the business, the other to homeowners' willingness and ability to spend if they feel poorer because of the trend in property prices.
About 10 million jobs are tied directly to residential real estate, from construction workers to escrow agents to the clerks at the local hardware store, Goldman Sachs estimates. That's about 7% of total U.S. employment. Some analysts believe the total is closer to 10%.
... employment cuts overall have been modest, at least as measured by government payroll data, which don't pick up freelance workers. Payroll jobs in residential construction totaled 3.31 million in August, off just fractionally from the 3.33 million at the start of the year, Labor Department data show.And on MEW:
Andy Perkins, San Diego branch manager for Orco Construction Supply, said he believed that job losses were just beginning as housing projects finish up and builders find little or no new demand.
...
Goldman Sachs estimates that the housing sector nationwide could shed 1.5 million to 2 million jobs over the next several years as the industry retrenches.
There also is the so-called wealth effect that housing prices have on consumers' spending.Using my method for calculating MEW, there was $504 Billion in 2004 (compared to Greenspan's estimate of $600 Billion). Although my method is conservative, it is the decrease in MEW that will impact consumer spending - and MEW appears to be decreasing in 2006.
Rocketing home prices over the last decade provided many Americans with an income windfall, either from the outright sales of houses at a profit or from mortgage refinancings or credit lines that allowed homeowners to cash in some of their accumulated equity.
A study coauthored by then-Federal Reserve Chairman Alan Greenspan last year estimated that mortgage-equity withdrawals tied to surging real estate values added $600 billion to consumers' disposable income in 2004 alone, making up about 7% of the total that year.
The LA Times article does a good job of discussing the first two impacts from the housing bust: lost housing related jobs, and the loss of MEW and the potential impact on consumer spending. This article does not discuss the impact from excessive leverage (and foreclosures) using nontraditional loans.
Volcker Sees Inflation Risks
by Calculated Risk on 9/26/2006 01:40:00 AM
From Bloomberg: Volcker Sees Risks of U.S. Inflation Creep, Pressure on Fed
Paul Volcker ... said he's worried both about inflation and pressure on the U.S. central bank to not do anything about it.
"I am a little bit more worried about inflation," said Volcker, 79, speaking at a discussion sponsored by the Women's Economic Round Table in New York yesterday. Gerald Corrigan, who served as New York Fed president from 1985 to 1993, said he shared Volcker's concerns.
While the inflation rate isn't "high" or "running away," Volcker said, "it is kind of creeping up, and I am impressed by the degree of pressure, if that is the right word -- psychological pressure, political pressure -- there is not to do anything about it."
Click image for video.
And this fits in with Dr. Tim Duy's Fed Watch tonight: Widening Disconnect
The countdown to the next FOMC meeting is underway, and the gap between market expectations and the Fedspeak appears to be widening. Quite honestly, I find such periods very, very uncomfortable, mostly because I feel Fed watching amounts to explaining a position taken by the Federal Reserve that the markets believe is increasingly untenable.
Monday, September 25, 2006
CAR: Existing Home Sales decrease 30.1%
by Calculated Risk on 9/25/2006 07:03:00 PM
The California Association of Realtors reports: C.A.R. reports sales decrease 30.1 percent in August, median price of a home in California at $576,360, up 1.6 percent from year ago
Home sales decreased 30.1 percent in August in California compared with the same period a year ago, while the median price of an existing home increased 1.6 percent ...According to NAR, nationwide existing home sales are off 12.6%, compared to 30.1% for California, since August 2005.
"We experienced the greatest year-to-year sales decline last month since August 1982, when sales fell 30.4 percent," said C.A.R. President Vince Malta....
Closed escrow sales of existing, single-family detached homes in California totaled 442,150 in August at a seasonally adjusted annualized rate... Statewide home resale activity decreased 30.1 percent from the 632,240 sales pace recorded in August 2005.
...
The median price of an existing, single-family detached home in California during August 2006 was $576,360, a 1.6 percent increase over the revised $567,320 median for August 2005 ... The August 2006 median price increased 1.7 percent compared with July’s revised $566,940 median price.
"Although the median price in the state and in several regions hit an all-time record in August, we expect softer prices toward the end of the year," said C.A.R. Vice President and Chief Economist Leslie Appleton-Young. ...
C.A.R.’s Unsold Inventory Index for existing, single-family detached homes in August 2006 was 6.8 months, compared with 2.6 months (revised) for the same period a year ago.
In a separate report covering more localized statistics generated by C.A.R. and DataQuick Information Systems, 61.7 percent, or 246 out of 399 cities and communities showed an increase in their respective median home prices from a year ago. DataQuick statistics are based on county records data rather than MLS information.
California's sales decrease accounts for over 20% of the U.S. sales decrease since last August. Yet California still has slightly less inventory on a month of sales basis: 6.8 months vs. 7.5 months for U.S. That is probably why median prices in California have held up slightly better than for the U.S.
I live in California, and everyone I talk with in the real estate business believes prices are falling ... and falling significantly in some areas like Sacramento and San Diego. It's not a good sign that California is holding up the U.S. statistics. I believe that will change soon.
Last 10 Posts
In Memoriam: Doris "Tanta" Dungey
Archive
Econbrowser
Pettis: China Financial Markets
NY Times Upshot
The Big Picture
| Privacy Policy |
| Copyright © 2007 - 2025 CR4RE LLC |
| Excerpts NOT allowed on x.com |


