by Calculated Risk on 10/27/2006 11:11:00 AM
Friday, October 27, 2006
Residential Investment as % of GDP
Real residential fixed investment decreased at an annualized rate of 17.4% in Q3 2006. Click on graph for larger image.
Residential investment (RI) has now fallen to 5.7% of GDP from the peak of 6.3% in the second half of 2005.
If RI falls back to the median level of the last 35 years (4.5% of GDP), the decline in RI has just started.
NOTE: It appears home equity extraction was strong in Q3 2006 based on preliminary GDP numbers (I'll post later today). So far there has been little spillover from the housing bust into the general economy, but that might be about to change for two reasons: 1) significant housing related job losses should start in Q4, and 2) declining home prices should start impacting MEW in Q4 or early 2007.
Thursday, October 26, 2006
Some Housing Quotes
by Calculated Risk on 10/26/2006 07:18:00 PM
Rex Nutting at MarketWatch asks: Has housing bottomed? Most economists say no. A few excerpts:
"Housing is going to be very inelastic to falling interest rates on the way down, just as it was very inelastic to rising rates on the way up," McCulley said. "To think otherwise after a bubble is to not understand bubbles. Risk appetite in property markets will not be restored by modest declines in market-determined interest rates."And on existing home inventory levels from the USA Today: Sellers sing the blues as price drop sets record
Real estate is "the ultimate momentum market," McCulley said. "Can't get enough on the way up and can't run away fast enough on the way down."
...
Jan Hatzius, chief economist for Goldman Sachs, figures that selling prices will fall about 3% in 2007 in both the realtors' index of median sales prices and in the more comprehensive price index published by the Office of Federal Housing Enterprise Oversight. The OFHEO index has never fallen in any calendar year.
Such declines "would likely put significant financial pressure on households," Hatzius said.
Pimco's McCulley figures that, based on historic relationships, if house price appreciation is zero in 2007, home sales will fall about 2.5 million from the peak to 6 million by January 2008. By that reckoning, we aren't even half way into the correction.
... about half of American homeowners who thought of selling their homes in the past year have delayed putting their homes on the market, according to a USA TODAY/Gallup poll conducted this month.
And roughly one-third of those who had considered selling have abandoned the idea.
NAR Adjustment
by Calculated Risk on 10/26/2006 04:09:00 PM
UPDATE: Dirk van Dijk says it was one more Saturday: see Zacks Equity Research Analyst Blog
In discussing the NAR Existing Home Sales report, I noted that the SA factor changed as compared to 2005. Several people have asked me about this - so let me explain. (SAAR: Seasonally Adjusted Annual Rate, NSA: Not Seasonally Adjusted)
First, here is the NAR data (NAR excel file).
Sept 2005:
NSA 630,000
SAAR 7,200,000
Factor: 11.43 (divide 7,200,000 by 630,000)
Sept 2006:
NSA 527,000
SAAR 6,180,000
Factor: 11.73
SAAR decline: 14.2%
NSA decline: 16.3%
I'm pretty sure NAR just uses a computer program to calculate the SAAR number. They plug in the raw data and it gives them the answer. It isn't anything nefarious. So why did the factor change?
First, the idea behind presenting the SAAR number is to make it is easy to compare between different periods. For example, sales are seasonally slow in January and February, so the adjustment to the NSA data is much larger than say for July and August. So the factor could be significantly different month to month, but all else being equal, the factor would be the same for the same month each year.
However some things are different. A common method to calculate SAAR from monthly data uses three components: seasonal, trend, and irregular (like weather, holidays or number of weekends in a month). If the trend stays the same, and there are no irregular component adjustments, then the seasonal adjustment would be the same.
I don't know if NAR uses any irregular adjustments. I don't think they adjust for weather, but they might be adjusting for the number of weekends during the sales period. But one thing is clear: the trend changed, and that impacts the SAAR number.
I have no idea what the NAR program is using for the trend, but during periods when the trend clearly changes, I prefer to use the NSA data to compare to previous years.
More on September New Home Sales
by Calculated Risk on 10/26/2006 11:58:00 AM
Please see the previous post: September New Home Sales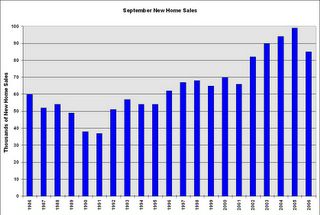 Click on graph for larger image.
This graph shows September New Home sales for the last 20 years. The recent sharp drop in sales is similar to the decrease at the start of the 1990s housing bust.
September sales have almost fallen back to the 2002 levels.
And this graph shows YTD New Home sales through September. It now appears that 2006 will finish as the 4th best year behind 2003.
Given that sales have fallen back to 2002/2003 levels, it would seem reasonable to expect that BLS reported residential construction employment will fall back to the levels of those same years. The following chart shows BLS data for the last 6 years.
| Residential Construction Employment, Monthly Average, Thousands | |||
| Year | Residential building | Residential specialty trade contractors | Total |
| 2001 | 781 | 1849 | 2630 |
| 2002 | 803 | 1887 | 2690 |
| 2003 | 837 | 1965 | 2802 |
| 2004 | 896 | 2123 | 3019 |
| 2005 | 949 | 2278 | 3227 |
| 2006 | 979 | 2346 | 3325 |
There will probably be 600K jobs lost in reported residential construction employment over the next couple of years - if housing stabilizes at this level. If housing continues to fall, something I think is likely, then even more jobs will be lost.
Over the next few quarters, completions is a better indicator of potential residential construction job losses than sales.
 This graph shows starts, completions and residential construction employment. (starts are shifted 6 months into the future). Completions and residential construction employment are highly correlated, and Completions lag Starts by about 6 months.
Based on historical correlations, it is reasonable to expect Completions and residential construction employment to follow Starts "off the cliff". This would indicate the loss of 300K to 400K residential construction employment jobs over the next 6 months.
 One of the most reliable economic leading indicators is New Home Sales.
New Home sales were falling prior to every recession of the last 35 years, with the exception of the business investment led recession of 2001. This should raise concerns about a possible consumer led recession in the months ahead.
September New Home Sales: 1.075 Million
by Calculated Risk on 10/26/2006 10:27:00 AM
According to the Census Bureau report, New Home Sales in September were at a seasonally adjusted annual rate of 1.075 million. Sales for August were revised down to 1.021 million, from 1.050 million. Numbers for June and July were also revised down.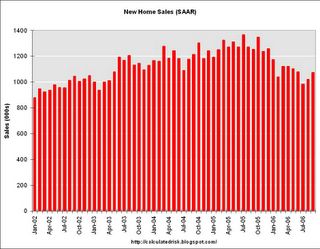
Click on Graph for larger image.
Sales of new one-family houses in September 2006 were at a seasonally adjusted annual rate of 1,075,000 ... This is 5.3 percent above the revised August rate of 1,021,000, but is 14.2 percent below the September 2005 estimate of 1,253,000.
The Not Seasonally Adjusted monthly rate was 85,000 New Homes sold. There were 99,000 New Homes sold in September 2005.
On a year over year NSA basis, September 2006 sales were 14.1% lower than September 2005. Also, Setpember '06 sales were below Setpember 2004 (94,000) and September 2003 (90,000) sales. This is the lowest September since 2002 when 82,000 new homes were sold.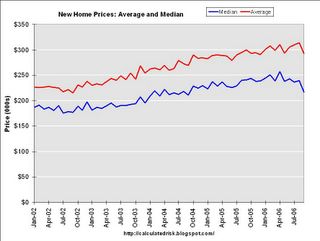
The median and average sales prices were down significantly. Caution should be used when analyzing monthly price changes since prices are heavily revised.
The median sales price of new houses sold in September 2006 was $217,100; the average sales price was $293,200.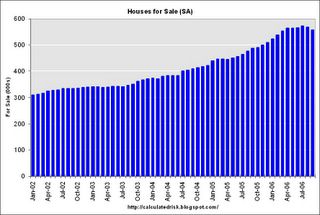
The seasonally adjusted estimate of new houses for sale at the end of September was 557,000. This represents a supply of 6.4 months at the current sales rate.
The 557,000 units of inventory is down slightly over the last two months. Inventory numbers from the Census Bureau do not include cancellations - and cancellations are at record levels. Actual New Home inventories are much higher.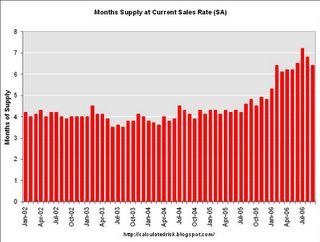
On a months of supply basis, inventory is above the level of recent years.
This another very weak report, especially considering the strong downward revisions for the previous months.
More later today on New Home Sales.
Wednesday, October 25, 2006
Fed: Soft Landing Achieved!
by Calculated Risk on 10/25/2006 02:28:00 PM
From the Fed statement today:
"Economic growth has slowed over the course of the year, partly reflecting a cooling of the housing market. Going forward, the economy seems likely to expand at a moderate pace."Compare this statement to the Sept 20th statement; the 2nd sentence was added. Soft landing achieved!
UPDATE: For more on Fed Statement, see:
Polley: Soft landing ahead? (I prefer the exclamation mark; in Fed speak, this is a celebration of victory)
Economist's View: Fed Leaves Target Rate Unchanged at 5.25%
NAR: Sales Down, Prices Down
by Calculated Risk on 10/25/2006 09:37:00 AM
The National Association of Realtors (NAR) reports: September Existing-Home Sales Ease
UPDATE: For fun, here is an alternate NAR press release:
Sales plummeted 16.3% from September 2005. This is a record YoY Sales decline.And here is the actual press release:
Median Prices dropped 2.2% from September 2005. Bloomberg: "... the biggest year- over-year decline since record-keeping began in 1969."
NAR changed the SA factor for September. Using the old SA factor, sales were 6.02 million SAAR, as compared to the reported 6.18 million SAAR. SA sales are now at mid-2003 levels.

Click on graph for larger image.
Existing-home sales eased last month, as did the number of homes available for sale – indicating the housing market is stabilizing, according to the National Association of Realtors®.
Total existing-home sales – including single-family, townhomes, condominiums and co-ops – dipped 1.9 percent to a seasonally adjusted annual rate of 6.18 million units in September from a level of 6.30 million in August, and were 14.2 percent below the 7.20 million-unit pace in September 2005, which was the third strongest month on record.

David Lereah, NAR’s chief economist, said stabilizing sales should build confidence in the housing market. "Considering that existing-home sales are based on closed transactions, this is a lagging indicator and the worst is behind us as far as a market correction – this is likely the trough for sales," he said. "When consumers recognize that home sales are stabilizing, we’ll see the buyers who’ve been on the sidelines get back into the market, and sales will be at more normal levels in the wake of the unsustainable boom that we saw last year." He noted sales already are improving in some areas.
Total housing inventory levels fell 2.4 percent at the end of September to 3.75 million existing homes available for sale, which represents a 7.3-month supply at the current sales pace.

NAR President Thomas M. Stevens from Vienna, Va., said the industry is encouraged that the number of homes on the market is starting to decline. “It appears we have passed a cyclical peak in terms of the number of homes on the market,” said Stevens, senior vice president of NRT Inc. “The good news is that fewer new listings are coming online. A stable sales pace is expected to draw down the number of listings to a supply balance that will support positive price growth within a few months. Taking the long view is always the best way to approach housing decisions, and right now, buyers are in a very favorable market.”Existing Home Sales are a trailing indicator. The sales are reported at close of escrow, so September sales reflects agreements reached in July and August.
With the market in transition, the national median existing-home price for all housing types was $220,000 in September, which is 2.2 percent below September 2005 when the median was $225,000. The median is a typical market price where half of the homes sold for more and half sold for less.
As I've noted before, usually 6 to 8 months of inventory starts causing pricing problem - and over 8 months a significant problem. With current inventory levels at 7.3 months of supply, inventories are now well into the danger zone and prices are falling in most regions.
MBA Weekly Survey
by Calculated Risk on 10/25/2006 09:18:00 AM
UPDATED with link to MBA Press Release.
The Mortgage Bankers Association (MBA) reports: Mortgage Applications Rise In Latest Survey Click on graph for larger image.
The Market Composite Index, a measure of mortgage loan application volume, was 588.6, an increase of 0.5 percent on a seasonally adjusted basis from 585.8 one week earlier. On an unadjusted basis, the Index increased 0.5 percent compared with the previous week and was down 13 percent compared with the same week one year earlier.Mortgage rates increased slightly:
The seasonally-adjusted Refinance Index increased by 1.8 percent to 1790.4 from 1758.2 the previous week and the Purchase Index decreased by 0.6 percent to 382.4 from 384.7 one week earlier.
The average contract interest rate for 30-year fixed-rate mortgages increased to 6.36 percent from 6.33 percent ...
The average contract interest rate for one-year ARMs increased to 5.97 percent from 5.94 percent ...

This second graph shows the Purchase Index and the 4 and 12 week moving averages since January 2002.
The MBA has added a four week moving average to their press release:
"The four week moving average for the seasonally-adjusted Market Index is up 0.9 percent to 601.9 from 596.3. The four week moving average is up 0.4 percent to 388.8 from 387.1 for the Purchase Index, while this average is up 1.6 percent to 1844.1 from 1815.9 for the Refinance Index."
Tuesday, October 24, 2006
Tim Duy's Fed Watch
by Calculated Risk on 10/24/2006 09:20:00 PM
Dr. Duy returns with another Fed Watch: Reappearing After a Long Absence
"... the outcome of this meeting is something of a foregone conclusion, with the Fed comfortable to sit on the sidelines for the time being. Incoming data still point to a slowdown in overall economic activity, but inflation remains well above any reasonable comfort level. As a group, the Fed still bets that the combination of slowing activity and moderating energy costs will be enough to bring core inflation down, albeit gradually.Oh my! Tim's pieces are always worth reading, but I'm not as sanguine as my fellow bloggers.
I find myself pulled in the same direction as William Polley and David Altig regarding the odds of a soft landing – it appears that the housing and auto slowdowns are mostly sector specific event at this point."
The next few quarters should tell the tale. Will the negative impact of housing related job losses, falling home prices, less equity extraction, and rising defaults and foreclosures, spillover into the general economy? Or will the consensus be correct: a soft landing with 3%+ GDP growth in 2007?
MBA 2007: Mortgage Originations to Fall, Housing Prices Flat
by Calculated Risk on 10/24/2006 07:02:00 PM
From Reuters: US mortgage creation to slide through 2007-MBA. From MBA chief economist Doug Duncan:
U.S. home loan generation will slide 19 percent this year to $2.46 trillion, the fifth-highest total on record, then drop another 14 percent in 2007 before stabilizing the following year...Duncan sees the economy rebounding in '07 and flat home prices in nominal terms:
Mortgage creation should drop to $2.12 trillion in 2007 and hold at that level in 2008 ...
The economy "rebounds from a weak second half of 2006 level, which is weak primarily due to the slowdown in housing and auto production," Duncan told Reuters. "The housing market will go through its trough in early 2007 and by the second half of 2007 will stabilize, and then will have returned to its longer-term trend of modest growth. Prices will likely be close to flat, if not flat in nominal terms."And on ARM resets and delinquencies:
The share of ARMS -- which have been a huge driver of loan origination, particularly as borrowers sought to get into costlier or bigger homes -- has been sliding and should continue to decline, the MBA said.
ARM share should drop to 19 percent of total loans by the end of 2008 from about 30 percent at the beginning of this year.
Some $1.1 trillion to $1.5 trillion of ARMs will be eligible to reset next year, the MBA estimated. How those loans play out could have a significant impact on the housing and mortgage debt markets.
...
Delinquencies and foreclosures will increase along with homeowner mortgage payments. The MBA is not forecasting levels but predicts they will be "manageable."
"Delinquencies are likely to rise modestly but they will primarily be in the sub-prime adjustable sector of the market and in those markets where house prices actually decline so that people don't have equity to solve their problems," Duncan said.
Last 10 Posts
In Memoriam: Doris "Tanta" Dungey
Archive
Econbrowser
Pettis: China Financial Markets
NY Times Upshot
The Big Picture
| Privacy Policy |
| Copyright © 2007 - 2025 CR4RE LLC |
| Excerpts NOT allowed on x.com |


