by Calculated Risk on 12/06/2006 06:20:00 PM
Wednesday, December 06, 2006
"Real Estate crash lessons have been forgotten"
Steven Pearlstein writes in the WaPo: An Economic Pillar on the Verge of Collapse
... enough hand-wringing over the residential real-estate market. Not much anyone can do about that now. The new story is the bubble in the commercial real estate market -- offices, hotels and retail establishments -- which has generated spectacular returns for investors over the past few years.From the FDIC report last month: Economic Conditions and Emerging Risks in Banking
Prices have risen to ridiculous levels, relative to the risk involved and the amount of income generated by these properties. But even those prices don't seem to scare away ... investors, who continue to pour hundreds of billions of dollars into real estate investment trusts, private-equity real estate funds and hedge funds that specialize in real estate finance.
...
What, exactly, does that mean?
First of all, it means that the lessons of the past five real estate crashes have, once again, been forgotten, and real estate has once again become a highly leveraged investment class.
Small and mid-size institutions have been increasing their concentrations in riskier assets, such as CRE loans and construction and development (C&D) loans. This suggests that, although small and mid-size institutions have been more successful in limiting the erosion of their nominal NIMs, they have achieved this success in part by assuming higher levels of credit risk.

... continued increases in concentrations and reports of loosened underwriting standards at FDIC-insured institutions signal the potential for future credit quality deterioration. In addition, regulators have noted increasing C&D and overall CRE loanAnd today from the FDIC, OCC and the Fed: Federal Banking Agencies Issue Final Guidance On Concentrations in Commercial Real Estate Lending
concentrations, especially at institutions with total assets between $1 billion and $10 billion. Four of six Regional Risk Committees expressed some level of concern about CRE lending, in part due to continuing increases in concentrations.
The Office of the Comptroller of the Currency, the Board of Governors of the Federal Reserve System, and the Federal Deposit Insurance Corporation on Wednesday issued final guidance on sound risk management practices for concentrations in commercial real estate lending. The guidance is intended to help ensure that institutions pursuing a significant commercial real estate lending strategy remain healthy and profitable while continuing to serve the credit needs of their communities.Back to Pearlstein:
The agencies have observed that commercial real estate is an area in which some banks are becoming increasingly concentrated. This trend is particularly evident among small-to medium-sized banks that are facing strong competition in other business lines. The agencies support banks serving a vital role in their communities by supplying credit for business and real estate development. However, the agencies are concerned that rising commercial real estate loan concentrations may expose institutions to unanticipated earnings and capital volatility in the event of adverse changes in commercial real estate markets.
... at some point this commercial real estate bubble will burst.... I can't tell you exactly how it will unfold, or when. But when it does ... everyone will look back and wonder why anyone could have doubted there was a bubble, why credit-rating agencies didn't warn of the risks, and why bank and securities regulators didn't step in.Well I guess bank regulators are expressing some concern on CRE (see new guidance). I think it is more difficult to call CRE a "bubble", as compared to the residential housing market, but the impact of a shakeout could be significant with the extensive leverage of buyers, and the loan concentration of mid-size institutions in CRE.
NY Times on Housing Prices
by Calculated Risk on 12/06/2006 11:15:00 AM
From the NY Times: What Statistics on Home Sales Aren’t Saying
The truth is that the official numbers on house prices — the last refuge of soothing information about the real estate market on the coasts — are deeply misleading. Depending on which set you look at, you’ll see that prices have either continued to rise, albeit modestly, or have fallen slightly over the last year. But the statistics have a number of flaws, perhaps the biggest being that they are based only on homes that have actually sold. The numbers overlook all those homes that have been languishing on the market for months, getting only offers that their owners have not been willing to accept.And: More on Housing Prices
In reality, homes across much of Florida, California and the Northeast are worth a lot less than they were a year ago.
In a falling market, with an enormous number of properties for sale, the houses that are selling tend to be more appealing than the average house.In the end, we are stuck with the data. As noted in the second article:
"We're dependent on houses that are actually transacting," said Patrick Lawler, the chief economist at the oversight agency, which is known as Ofheo. "It's true that may not evenly reflect the market."
Right now, all these flaws seem to be making house values look much stronger than they really are. According to the latest index, for example, the average house in Miami would have sold for 22 percent more this summer than a year earlier. You won't find many house sellers in Miami who would agree that's true.
As Thomas Lawler, a housing economist (and no relation to Patrick Lawler), recently wrote in a report to clients, "Well, there's a growing view that this index...doesn't reflect what's really going on with home prices."
Mr. Lawler of Ofheo disputes that. He acknowledges that the index has fewer high-priced houses than the market as a whole but says that it still picks up many expensive homes, because they often have mortgages worth much less than the house's value. He also pointed out that the Ofheo data covers only single-family homes, not condominiums (which in many markets are doing worse than houses).
More broadly, Mr. Lawler says that the Ofheo index is based on an enormous amount of data that is more accurate than any individual perceptions of a local real-estate market. "The indexes," he said, referring to Ofheo's measure and others, "all do a good job of measuring what they're designed for."
Mr. Shiller and his colleagues have opted not to adjust their numbers, since any corrections "would be ad-hoc corrections that would not be objective."Over time, the official data will show the actual impact on prices.
MBA: Rates Fall and Mortgage Applications Rise
by Calculated Risk on 12/06/2006 12:24:00 AM
The Mortgage Bankers Association (MBA) reports: Rates Fall and Mortgage Applications Rise In Latest Survey 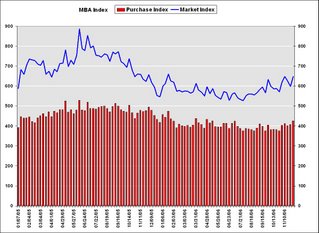 Click on graph for larger image.
The Market Composite Index, a measure of mortgage loan application volume, was 647.6, an increase of 8.1 percent on a seasonally adjusted basis from 599 one week earlier. On an unadjusted basis, the Index increased 52 percent compared with the previous week and was up 1.9 percent compared with the same week one year earlier.Mortgage rates declined:
The seasonally adjusted Refinance Index increased by 13.7 percent to 1989.7 from 1749.6 the previous week and the Purchase Index increased by 4.9 percent to 426.6 from 406.7 one week earlier.
The average contract interest rate for 30-year fixed-rate mortgages decreased to 5.98 from 6.13 percent ...
The average contract interest rate for one-year ARMs decreased to 5.79 percent from 5.87 ...
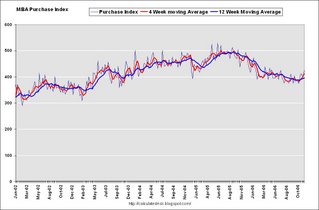 The second graph shows the Purchase Index and the 4 and 12 week moving averages since January 2002. The four week moving average is up 1.5 percent to 411.9 from 405.8 for the Purchase Index.
The refinance share of mortgage activity increased to 50.1 percent of total applications from 46.9 percent the previous week. The refinance share is at its highest level since April 2004. The adjustable-rate mortgage (ARM) share of activity decreased to 23.9 from 24.5 percent of total applications from the previous week. The ARM share is at its lowest level since October 2003.
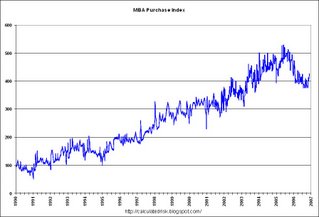 The third graph shows the MBA purchase index since 1990. There has been a clear uptrend in recent weeks. The purchase index is about 14% below the comparable week in 2005.
With the dramatic drop in the ten year yield (4.44% today), the 30 year mortgage has once again fallen under 6%. Based on Freddie Mac's monthly data, this is the first time the 30 year rate has been below 6% since September 2005.
Tuesday, December 05, 2006
Bob Toll: "I didn't mean to project optimism"
by Calculated Risk on 12/05/2006 03:22:00 PM
From Yahoo: Toll Brothers Earnings Conference Call (Q4 2006)
Credit Suisse's Ivy Zellman asked the best questions (starts at 50 minutes 30 seconds), including a few funny remarks:
"Which Kool-aid are you drinking?"She challenged Toll Chairman Bob Toll about his optimism this morning, and Mr. Toll responded:
"I didn't mean to project optimism."And she made this comment directly to Bob Toll (who sold a significant amount of stock in the Summer of 2005):
"I think a lot of people, if they ever follow you Bob, and your buying and selling personally, they made a lot of money."I've been on both sides of conference calls, and the Toll team seemed unprofessional to me at times. Update: As I noted in the comments, at times they seemed disorganized and they seemed to stray from their talking points. As an example, at one point Mr. Toll mentioned that demand would increase in D.C. because of the recently elected Congressman and Senators. Of course just as many ex-Congressman and Senators will probably be leaving D.C., so it was difficult to understand how this would impact their business in a material way. It seemed like Mr. Toll was winging it - I doubt this was a key talking point for the company.
Disclaimer: I have no position in Toll.
Monday, December 04, 2006
Will Europe Decouple from the U.S.?
by Calculated Risk on 12/04/2006 06:31:00 PM
From the Financial Times: Europe bets on weathering a US downturn
... can that tale of two diverging economies be true? Most economists had the same thoughts back in 2001 when, in the midst of a US recession, the chancelleries and ministries of Europe were confident that the old continent could go it alone. ... But within a few years, such hopes had evaporated. Europe’s main economies had slowed to a crawl as the collapse of the dotcom boom and terrorism hit the global economy. Will it be different this time? Is Europe’s economy really “decoupling” from that of the US?But won't there be a housing bust in Europe too?
...
Mervyn King, governor of the Bank of England, ...said ... “In 2000, when we also had this debate, the original shock was a worldwide slowdown in the IT sector. What we’re seeing now in the US is not a consequence of a worldwide slowdown – world growth has been and continues to be pretty strong – rather we’re seeing a slowdown in the US housing market.”
Other reasons for optimism mentioned in the article include increased European internal demand, the reduced dependence of Europe on trade with the US, and the "health and potential strength of European labour markets".
For more international issues, see Brad Setser: Good reading on the dollar’s recent move
For the Holidays
by Calculated Risk on 12/04/2006 12:42:00 PM
Sasha and Christina perform "Hurt" at Christmas in Rockefeller Center 2006.
Fed Fund Probabilities
by Calculated Risk on 12/04/2006 11:27:00 AM
After the raft of weak economic news last week, the market expectations for a rate cut in March have increased (based on Fed Funds futures):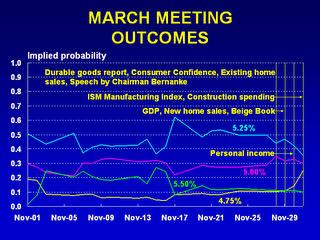 Click on graph for larger image.
Source: Cleveland Fed, Fed Funds Rate Predictions
The expectations of a 50bps rate cut in March are 25%, and for a 25 bps rate cut almost another 30%.
This is more evidence for Carlone Baum's article last week: The Fed Cries Wolf; Mr. Market Isn't Listening
Federal Reserve officials are getting a first-hand lesson in the law of diminishing returns: Try as they might, they can't seem to get the same mileage from their hawkish rhetoric.
In the past few months, every time a policy maker found a waiting platform, he or she used the opportunity to remind us that the Fed is more concerned about rising inflation than slowing growth.
Their words had predictable results. The prices of interest- rate futures contracts that reflect expectations of Fed policy sank, wiping out the gains registered on weak economic data.
...
Then something strange happened. The market stopped listening.
Friday, December 01, 2006
The Housing Optimists
by Calculated Risk on 12/01/2006 02:31:00 PM
In spite of the steady stream of bad news for housing, there are a growing number of forecasters and stock analysts that are bullish on housing and housing stocks. They believe the worst is over, and the bottom is near for the housing market.
From the LA Times this morning: Optimism is rising on housing market
Falling mortgage rates and a rally in home builder stocks are leading some analysts to suggest that the worst of the nation's housing slump may be over.And from the Motley Fool: On the Up-And-Up
Although data released Thursday showed U.S. home prices making their smallest quarterly gain in eight years, some forward-looking indicators point to a stabilizing residential market.
Home builder stocks rallied sharply Thursday after an analyst's upgrade. The sector was one of the strongest in November, with the Standard & Poor's home builder index gaining 10% last month, extending a rally that began in July and suggesting that investors see an improving outlook.
"While this real estate cycle has yet to play itself out, we are skeptical of the dire warnings of pundits," Zachary Karabell and Daniel Chung, analysts at investment firm Fred Alger & Co., said Wednesday in a client note.
The homebuilders are rising again, and for good reason: They are beginning to discount better conditions in the housing market. ... Bank of America Securities analyst Daniel Oppenheim upgraded several of the builder stocks today, saying he sees an "improvement in traffic, affordability and construction trends." ...The Citigroup analysts seem to put significant weight on prices. I'm not sure what the Citigroup analysts were expecting, but in a typical housing bust, prices first flatten out, and then decline over a multi-year period. My housing price predictions for 2006 (from December 2005):
Even with the upgrade and recent stock rally, many analysts still remain cautious -- if not outright bearish -- on the sector. ...
Oppenheimer himself seemed to proceed with caution, despite his upgrade. "We do not expect a smooth upward move, but expect choppiness over the next 12-24 months based on the excess inventory, as it will take time to work through the oversupply," he said in Thursday's research note to clients.
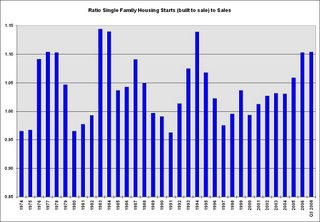
He fails to see the big picture, as do so many of the current housing bears. They remain micro-focused on inventory without seeing inventory in relation to sales. They fail to put inventory in context, which is a serious analytical mistake. Every industry looks at the inventory-to-sales ratio, and housing should be no exception. Having said that, consider that the ratio of single-family housing starts to sales is now at the lowest level since the government started recording this data in 1963.
... Stop listening to these know-nothings talk about the inventory, because it will soon be coming down -- and when it does, they will be scrambling to upgrade their views.
... median prices will probably increase slightly, with declines in the more "heated markets".For housing prices, so far, I'm seeing about what I expected. So I'm surprised the Citigroup analysts see prices as a positive. Perhaps they viewed the boom as based on fundamentals, as opposed to my view that there was excessive speculation. As I've noted before, how one viewed the boom, colors how one views the bust.
With regards to the Motley Fool piece, the Starts to Sales ratio does tell you when an industry is starting to work down any excess inventory. But you also have to analyze the level of excess inventory.
Of course, it also helps to use the correct data! The Motley Fool writer used single family starts that includes homes being built by the owner. This is the wrong number to compare to sales.
 Click on graph for larger image.
To calculate Starts to Sales, you should use the Single Family starts, built for sale numbers from the Census Bureau. This series is quarterly and begins in 1974.
This graph shows the correct Starts to Sales ratio (note 2006 is through the first 3 quarters, and I included the ratio for Q3 2006). Apparently I'm a "know-nothing", but at least I'm using the correct data series.
But the above analysis only tells us when the builders are starting to work off the excess inventory - and that hasn't started yet since starts are still higher than sales. We also need to look at the current inventory. And not just inventory of New Homes, but inventory of competing products: existing homes and rentals.
 As I noted yesterday, inventories of existing homes are at about 5% as a percent of total owner occupied units. This is an all time record, and is well above the median inventory levels of 3% of owner occupied units.
This high level of existing home inventory should depress new home sales and put pressure on prices.

And we also need to look at new home inventories. Currently the Census Bureau is reporting inventory of 558,000 units. Inventory numbers from the Census Bureau do not include cancellations - and cancellations are at record levels. Actual New Home inventories are much higher - some estimates about 20% higher.
All and all, I don't find any of the optimists' arguments the least bit convincing.
October Construction Spending
by Calculated Risk on 12/01/2006 10:36:00 AM
From the Census Bureau: October 2006 Construction at $1,178.4 Billion Annual Rate
The key is that nonresidential construction declined for the second consecutive month.
Nonresidential construction was at a seasonally adjusted annual rate of $308.2 billion in October, 0.7 percent below the revised September estimate of $310.2 billion.
 Click on graph for larger image.
Residential construction spending peaked in December 2005, and the typical pattern is for nonresidential construction to peak 3 to 5 quarters after residential construction. It appears that nonresidential construction peaked in August 2006 - right on schedule.
The continued decline in residential construction spending was about as expected, and will continue at around this pace, at least through mid-2007, based on housing starts.
Residential construction was at a seasonally adjusted annual rate of $597.1 billion in October, 1.9 percent below the revised September estimate of %608.8 billion.
Thursday, November 30, 2006
Historical: Existing Home Sales and Inventory
by Calculated Risk on 11/30/2006 01:14:00 PM
The following graphs show existing home sales and inventory for the last 30+ years. The data is from NAR (via HUD, see table 7)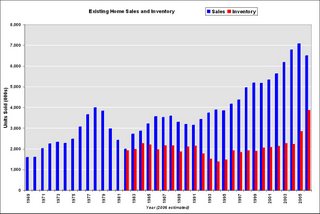 Click on graph for larger image.
The first graph shows unit sales and inventory. Inventory is only available since 1982, and 2006 is estimated at 6.5 million sales, and 3.85 million homes for sale (current inventory numbers).
From 1978 to 1982, sales declined by 50%, from almost 4 million units per year to under 2 million units per year. In 1982, inventory almost equaled sales; the months of inventory was 11.5 (compared to 7.4 currently). For the second graph, sales and inventory are normalized by the number of owner occupied units. This shows the extraordinary level of sales for the last few years, reaching 9.5% of owner occupied units in 2005. The median level is 6.0% for the last 35 years.
Some of the sales were for investment and second homes, but normalizing by owner occupied units probably provides a good estimate of normal turnover.
Credit Suisse (Nov 27, 2006) is are projecting existing home sales will fall to 5.9 million units in 2007. If inventories stay at the current level that would be about 8 months of inventory.
If sales fall back to 6% of owner occupied units that would be 4.5 million units per year - a significant decline from current levels.


