by Calculated Risk on 1/30/2007 06:43:00 PM
Tuesday, January 30, 2007
JPMorgan CEO: Recession Signs
From MarketWatch: Dimon sees a sign of recession
Rising defaults in some of the riskiest home loans offered by J.P. Morgan Chase & Co. signal a recession may be looming, Jamie Dimon, the bank's chief executive said Tuesday.Did someone just say "credit crunch"?
Dimon, speaking at Citigroup's annual financial services conference, said high-risk loans - as measured by credit scores and loan-to-value ratios of 90% or more -- make up 2% of the bank's home equity portfolio, Dimon said according to a live webcast.
He also said defaults are rising at J.P. Morgan "a little bit," adding, "home equity is subject to deterioration" from a recession, but that the bank is well positioned to sustain a downturn in the economy. The bank has largely exited the subprime lending area.
Give Bernanke Credit
by Calculated Risk on 1/30/2007 04:28:00 PM
"We've never had a decline in housing prices on a nationwide basis. What I think is more likely is that house prices will slow, maybe stabilize ... I don't think it's going to drive the economy too far from its full-employment path, though."From the AP: Thumbs Up for Bernanke on First Year
Dr. Bernanke, July 29, 2005
The economy tested Federal Reserve Chairman Ben Bernanke during his first year on the job. A sinking housing market and a troubled auto industry threatened to short-circuit economic activity. Gyrating energy prices threatened as well.Although I've disagreed with Bernanke at times, I think he deserves credit so far. I included the above quote as a point of disagreement - I expect we will see housing prices decline on a nationwide basis in 2007.
By most accounts, the Fed chairman passed.
I'd also argue that Bernanke hasn't been tested yet. From Stephen Roach in late 2005:
"Alan Greenspan faced a stock-market crash two months after he took over in August 1987. Paul Volcker had to cope with a rout in the bond market three months after he became chairman in August 1979. G. William Miller was challenged immediately by a dollar crisis in the spring of 1978. For Arthur Burns, it was the inflation bogie in the early 1970s."So far Bernanke hasn't faced anything like the challenges of his predecessors, but I do feel a little vindicated for supporting his nomination.
Monday, January 29, 2007
Record Homeowner Vacancy Rate
by Calculated Risk on 1/29/2007 05:02:00 PM
The Census Bureau reports the Homeowner Vacancy Rate was a record 2.7% in Q4 2006. Click on graph for larger image.
This graph shows the recent surge in the homeowner vacancy rate. This is further evidence of the significant supply overhang in the housing market.
Fannie Mae economist David Berson has estimated the overhang at 600K units. This data from the Census Bureau suggests the overhang may be closer to my estimate of 1.1 to 1.4 million units.
Update: For a 50 year chart see: Empty homes everywhere
Sunday, January 28, 2007
OC Register on Subprime Lenders
by Calculated Risk on 1/28/2007 06:24:00 PM
From the OC Register: Subprime's grip slips
Many of Orange County's boldest lenders are struggling to stay in the black – and in some cases to stay in business – as their customers miss mortgage payments in record numbers.The article has this great quote:
...
Sluggish home prices, rising interest rates and lax underwriting spurred defaults on subprime loans made just last year to the highest level in six years. Perhaps most troubling, loans made by Orange County companies in 2006 were among the quickest to see defaults, data show.
And many of those subprime companies – which tend to cluster here in Orange County – are in trouble.
...
UBS Investment Bank ... found subprime loans made in 2006 are on track to be the worst-performing loans ever issued.
...
So what went wrong, exactly?
Lenders made two mistakes, according to UBS and other analysts. They didn't scrutinize borrowers' incomes, and they allowed subprime borrowers, who by definition have had past problems with their credit, to take on lots of risk.
...
Borrowers gambled on rising home prices to bail them out of trouble, analysts said. Consumers thought home prices would keep climbing, which would enable them to sell or refinance if they got into a jam, analysts said.
"[Borrowers] lost the motivation or incentive to send in the checks."This sounds like a quote from "Office Space":
David Liu, director of UBS' mortgage strategy group, Jan 28, 2007
PETER: I, uh, I don't like my job. I don't think I'm gonna go anymore.
JOANNA: You're just not gonna go?
PETER: Yeah.
JOANNA: Won't you get fired?
PETER: I don't know. But I really don't like it so I'm not gonna go.
JOANNA (LAUGHS) SO YOU'RE GONNA QUIT?
PETER: No, no, not really. I'm just gonna stop going.
JOANNA: When did you decide all that?
PETER: About a week ago.
JOANNA: Really?
PETER: Oh, yeah.
JOANNA: Ok. So, so you're gonna get another job?
PETER: I don't think I 'd like another job.
JOANNA (LAUGHS): SO WHAT ARE YOU GOING TO DO ABOUT MONEY AND BILLS?
PETER: Y'know, I never really liked paying bills. I don't think I'll do that either.
Saturday, January 27, 2007
On Blogging
by Calculated Risk on 1/27/2007 12:24:00 PM
This is my first post with the new blogger. I'd like to take this moment to offer some thoughts on my blogging experience:
I started blogging just to share a few thoughts with my friends. To my surprise, more and more people have been reading this blog - and happily I've made several new internet friends. That was unexpected and has been very rewarding for me.
The downside to more readers is I'm not able to answer all the questions in the comments or sent to me in emails. I appreciate all the emails and information I receive, and please accept my apology if I miss your question or I'm slow to respond to your email. I also receive many other inquiries or requests: interviews, link exchanges, offers for sponsorship, etc.
Given all these requests, I'd like to make this clear: this is a personal blog, I've made no effort to market this blog, I haven't accepted advertising or sponsorships, and I'm not looking for any publicity for myself or for this blog. I have no current plans to change my approach.
Perhaps readers have a sense of my personalty from this blog. One of the highlights for me was Don Luskin complaining I was "too polite"! I'm also happy to correct any mistakes I make, and point out when I've been wrong. These traits have served me well in real life.
I believe the one major misperception is that I'm all doom and gloom. Readers have frequently expressed surprise, in the comments, and occasionally via email, at my positive long term outlook. This reaction is probably understandable since most of my posts have a bearish economic tone.
At the time I started writing this blog, I was becoming increasingly concerned about the apparent excessive speculation in the housing market. I was also concerned that the inevitable housing correction might have a negative impact on the U.S. economy. Add in my very negative views of the current U.S. administration, and naturally my posts have had a cautious tone.
I've discovered there is quite an industry of publications catering to people's fears. My negative posts have led to several offers to write for these doom and gloom websites and magazines. That isn't me, and I've declined all these offers. I'm looking forward to being positive in my posts - maybe I'll get offers from Wall Street then!
That is all for now. My best to everyone, and hopefully the new blogger will work well.
Friday, January 26, 2007
More on December New Home Sales
by Calculated Risk on 1/26/2007 06:08:00 PM
Please see the earlier post: December New Home Sales
2006 is the 4th best year for New Home Sales behind 2003.
| New Home Sales | |
| Year | Sales |
| 2000 | 877,000 |
| 2001 | 909,000 |
| 2002 | 972,000 |
| 2003 | 1,088,000 |
| 2004 | 1,203,000 |
| 2005 | 1,283,000 |
| 2006 | 1,063,000 |
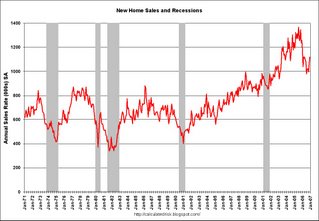
 Click on graph for larger image.
One of the most reliable economic leading indicators is New Home Sales.
New Home sales were falling prior to every recession of the last 35 years, with the exception of the business investment led recession of 2001. This should raise concerns about a possible consumer led recession in the months ahead.
Some more optimistic observers will argue that sales have fallen back to a sustainable level after the excesses of 2004 and 2005. Others will argue that sales have to fall more in coming years, to make up for the excesses of recent years. That is one of the reasons 2007 will be such an interesting year.

The second graph shows monthly Not Seasonally Adjusted (NSA) New Home sales. This provides a different prospective of the housing bust.
This shows why the Spring selling season is so important in 2007. Will sales recover? Or will Spring 2007 look like 1982 or 1991 when Spring sales were disappointing.
NY Times: Tremors at the Door
by Calculated Risk on 1/26/2007 10:36:00 AM
“The market is paying me to do a no-income-verification loan more than it is paying me to do the full documentation loans. What would you do?”From the NY Times: Tremors at the Door
William D. Dallas, the chief executive of Ownit Mortgage Solutions, Jan 26, 2007
Wall Street’s big bet on risky mortgages may be souring a lot faster than had been previously thought.
...
The grim statistics ... also indicate that mortgage lenders became more generous last year, giving 100 percent financing and allowing borrowers to state their incomes with little or no documentation in an effort to bolster volume, according to industry experts.
Banking regulators have increasingly voiced concerns about the loosening of lending practices by subprime lenders. Late last year some demanded that applicants be more closely vetted before being qualified for adjustable-rate and other risky loans.
Yet, housing advocates and industry experts say policy makers are also worried that too sharp a pullback in lending by Wall Street and commercial banks could cut off consumer access to credit.
December New Home Sales: 1.12 Million SAAR
by Calculated Risk on 1/26/2007 10:09:00 AM
According to the Census Bureau report, New Home Sales in December were at a seasonally adjusted annual rate of 1.12 million. Sales for November were revised up to 1.069 million, from 1.047 million. Numbers for September and October were revised downwards. 
Click on Graph for larger image.
Sales of new one-family houses in December 2006 were at a seasonally adjusted annual rate of 1,120,000... This is 4.8 percent above the revised November rate of 1,069,000, but is 11.0 percent below the December 2005 estimate of 1,259,000.
The Not Seasonally Adjusted monthly rate was 76,000 New Homes sold. There were 87,000 New Homes sold in December 2005.
On a year over year NSA basis, December 2006 sales were 12.6% lower than December 2005. Also, December '06 sales were below December 2004 (83,000).
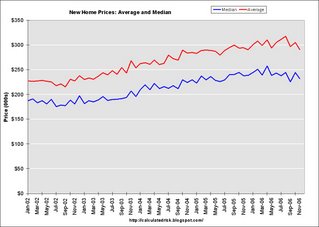
The median and average sales prices were mixed. Caution should be used when analyzing monthly price changes since prices are heavily revised.
The median sales price of new houses sold in December 2006 was $235,000; the average sales price was $290,100.
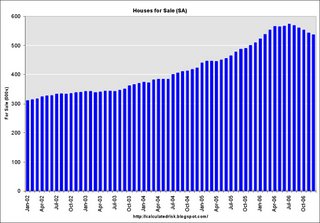
The seasonally adjusted estimate of new houses for sale at the end of December was 537,000.
The 537,000 units of inventory is slightly below the levels of the last six months. Inventory numbers from the Census Bureau do not include cancellations - and cancellations are at record levels. Actual New Home inventories are much higher - some estimate about 20% higher.
This represents a supply of 5.9 months at the current sales rate.
More later today on New Home Sales.
Thursday, January 25, 2007
Existing Home Sales as Percent of Owner Occupied Units
by Calculated Risk on 1/25/2007 03:55:00 PM
First, a couple of quotes from the NAR press release today:
“It looks like we’re moving beyond the low for the housing cycle last fall ..."
David Lereah, NAR’s chief economist, Jan 25, 2007
"... we’re looking for slow, steady gains in both home sales and prices through 2008.”Last month economist David Berson at Fannie Mae projected existing home sales would fall to 5.925 million units in '07 (NAR reported 2006 sales at 6.48 million units today). Will sales rise in '07 as forecast by the NAR spokesmen, or will sales fall as projected by Fannie Mae economists and others?
NAR President Pat Vredevoogd Combs, Jan 25, 2007
 One of the rarely told stories of the housing boom was the jump in turnover of existing homes. This graph shows sales normalized by the number of owner occupied units. This shows the extraordinary level of sales for the last few years, reaching 9.5% of owner occupied units in 2005. The median level is 6.0% for the last 35 years.
Some of the sales were for investment and second homes, but normalizing by owner occupied units probably provides a good estimate of normal turnover. If sales fall back to 6% that would about 4.6 million units. If sales fall back to the level of 1998 to 2001 (7.3% of total owner occupied units sold) that would be about 5.6 million units in 2007.
My guess is existing home sales will "surprise" to the downside, perhaps in the 5.6 to 5.8 million unit range, or approximately 7.5% of owner occupied units.
Note: from my Housing in 2007 predictions.
Unemployment Insurance Weekly Claims
by Calculated Risk on 1/25/2007 10:51:00 AM
Here is a bad headline from the AP: Jobless claims rise to 16-month high.
The U.S. Department of Labor reported:
In the week ending Jan. 20, the advance figure for seasonally adjusted initial claims was 325,000, an increase of 36,000 from the previous week's revised figure of 289,000. The 4-week moving average was 309,250, an increase of 1,500 from the previous week's revised average of 307,750.Just 4 weeks ago claims were also 325,000, and in the last week of November, claims were 358,000. So why is this a "rise to a 16-month high"?
The AP is referring to the increase in claims from last week.
The Labor Department reported Thursday that 325,000 newly laid-off workers filed claims for jobless benefits last week, an increase of 36,000 from the previous week. That was the biggest one-week rise since a surge of 96,000 claims the week of Sept. 10, 2005, when devastated Gulf Coast businesses laid off workers following Hurricane Katrina.Why does anyone care? Weekly claims are notoriously noisy week to week, so everyone follows the 4-week moving average.
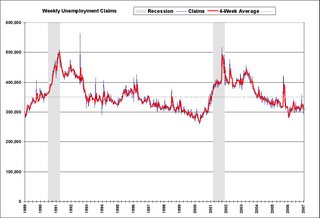
 Click on graph for larger image.
This graph shows the weekly unemployment claims and the 4-week moving average vs. recessions since 1989. The dashed line at 350,000 is the level of concern for the 4-week moving average.
Currently the 4-week average is 309,250; not a concern.
Last 10 Posts
In Memoriam: Doris "Tanta" Dungey
Archive
Econbrowser
Pettis: China Financial Markets
NY Times Upshot
The Big Picture
| Privacy Policy |
| Copyright © 2007 - 2025 CR4RE LLC |
| Excerpts NOT allowed on x.com |


