by Calculated Risk on 7/27/2007 10:20:00 PM
Friday, July 27, 2007
Census Bureau: Vacancy Rates Decline Slightly in Q2
From the Census Bureau on Residential Vacancies and Homeownership
National vacancy rates in the second quarter 2007 were 9.5 (+/- 0.4) percent for rental housing and 2.6 (+/- 0.1) percent for homeowner housing, the Department of Commerce’s Census Bureau announced today. The Census Bureau said the rental vacancy rate was not statistically different from the second quarter rate last year (9.6 percent), but was lower than the rate last quarter (10.1 percent). For homeowner vacancies, the current rate was higher than a year ago (2.2 percent), and lower than the rate last quarter (2.8 percent). The homeownership rate at 68.2 (+ 0.5) percent for the current quarter was lower than the second quarter 2006 rate (68.7 percent), but was not statistically different from the rate last quarter (68.4 percent).
 Click on graph for larger image.
The first graph shows the homeowner vacancy rate since 1956. A normal rate for recent years appears to be about 1.7%. There is some noise in the series, quarter to quarter, but it does appear the decline in Q2 was statistically significant.
This small decline in Q2 leaves the homeowner vacancy rate almost 1% above normal, or about 750 thousand excess homes.
 The rental vacancy rate has been trending down for almost 3 years (with some noise). This was due to a decline in the total number of rental units in 2004, and more recently due to more households choosing renting over owning.
It's hard to define a "normal" rental vacancy rate based on the historical series, but we can probably expect the rate to trend back towards 8%. This would suggest there are about 600 thousand excess rental units in the U.S. that need to be absorbed.
More on this when I finish my mid-year housing update.
BEA: Q2 Mortgage Debt Increase
by Calculated Risk on 7/27/2007 06:46:00 PM
Note: This is an estimate of the total increase in household mortgage debt, not to be confused with MEW (Mortgage Equity Withdrawal or extraction). MEW is a subset of this amount. The gold standard for net equity extraction is the Kennedy-Greenspan data usually available, courtesy of Dr. Kennedy, a few days after the Fed's Flow of Funds report is released. For Q2 2007, the Flow of Funds report is scheduled to be released on September 17, 2007.
As a supplement to the advance GDP report (released today), the BEA provides an estimate of mortgage interest paid for the quarter, and the effective mortgage interest rate. With a little work, an estimate of the total increase in mortgage debt for the quarter can be derived. Click on graph for larger image.
This graph shows the quarterly increase in household mortgage debt based on the Fed's Flow of Funds report compared to the BEA derived increase in mortgage debt. Note that the BEA data is Seasonally Adjusted (SA) and the Flow of Funds data is Not Seasonally Adjusted (NSA).
NOTE: It is difficult to compare NSA vs. SA data. In this case, the current quarter (Q2) appears to have the least seasonal adjustment. Use with caution: my confidence in this analysis for any single quarter is not high.
The BEA data suggests that total household mortgage debt increased by $188 Billion in Q2. If this estimate is close, this suggests that MEW increased in Q2 - possibly boosting consumer spending. If this advance estimate is correct, this will be a surprise - an understatement - and raise even more concerns about consumer spending later this year.
GDP and Fixed Investment
by Calculated Risk on 7/27/2007 09:49:00 AM
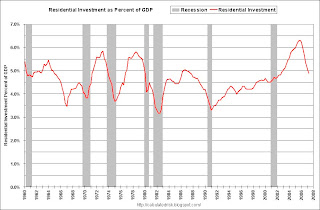
The first graph shows Residential Investment (RI) as a percent of GDP since 1960. Click on graph for larger image
Residential investment, as a percent of GDP, has fallen to 4.88% in Q2 2007. The median for the last 50 years is 4.58%.
Although RI has fallen significantly from the cycle peak in 2005 (6.3% of GDP in Q3 2005), RI as a percent of GDP is still well above all the significant troughs of the last 50 year (all below 4% of GDP). Based on these past declines, RI as a percent of GDP could still decline significantly over the next year or so.
The fundamentals of supply and demand also suggest further significant declines in RI.
Non Residential Structures Investment in non-residential structures continues to be very strong, increasing at a 22% annualized rate in Q2 2007.
The second graph shows the YoY change in Residential Investment (shifted 5 quarters into the future) and investment in Non-residential Structures. In a typical cycle, non-residential investment follows residential investment, with a lag of about 5 quarters. Residential investment has fallen significantly for five straight quarters. So, if this cycle follows the typical pattern, non-residential investment will start declining later this year.
Right now it appears the lag between RI and non-RI will be longer than 5 quarters in this cycle. Although the typical lag is about 5 quarters, the lag can range from 3 to about 8 quarters. The third graph shows the YoY change in nonresidential structure investment vs. loan demand data from the Fed Loan survey. Unfortunately the demand survey data is only available since 1995, but the correlation is clear: falling demand leads lower investment by about a year. The causation is obvious, loans taken out today impact investment over the next couple of years.
This data suggests that nonresidential structure investment is likely to follow the decline in residential investment later this year.
Equipment and Software The final graph shows the typical relationship between residential investment (shifted 3 quarters) and fixed investment in equipment and software. Usually investment in equipment and software follows residential investment by about 3 quarters.
Although the YoY change in real investment in equipment and software is weak, investment picked up in Q2 at a 2.3% annual rate.
Q2 GDP: 3.4%
by Calculated Risk on 7/27/2007 08:45:00 AM
From the BEA: Gross Domestic Product
As expected, PCE (personal consumption expenditures) growth slowed sharply to 1.3% in the second quarter.
The bright spots in the report: Net exports of goods and services contributed 1.18%, and government spending contributed 0.82%, and non-residential fixed investment 0.83%.
Investment in non-residential structures increased at a 22% annualized rate!
I'll post on fixed investments later today.
Thursday, July 26, 2007
Markets Looking for a Rate Cut
by Calculated Risk on 7/26/2007 08:26:00 PM
The futures market is now pricing in a rate cut in December with some chance of a rate cut by October. From the WSJ: Futures Markets Bet Fed Will Cut Rates This Year
Trading in December fed funds contracts translates into the market giving 100% certainty that the Fed will cut rates to 5% by the Dec. 11 Fed meeting from the current 5.25% rate. That is up from about a 44% chance at Wednesday’s close. The market is pricing in roughly 50% odds that the FOMC could cut the rate as early as the September or October meetings.That doesn't quite fit with the data from the Cleveland Fed, but clearly market participants see the odds of a rate cut increasing. And yes, that is a 20% implied probability of a 50 bps rate cut by the October meeting:
There is no question what the impacted CEOs want: AutoNation CEO Urges Rate Cut To Prop Up Sagging Vehicle Sales
The chief executive of the nation's largest publicly traded auto-dealership chain is disputing suggestions that the housing slowdown is contained, attempting to drum up support for interest-rate cuts that would help sagging vehicle sales.
Mike Jackson, head of AutoNation Inc., ... took issue with Federal Reserve Chairman Ben Bernanke's recent suggestions that the housing slump won't significantly crimp economic growth over time. "Absent a rate cut, which will both have a financial impact and a psychological impact, I think it's going to take a long time to work through -- a long time," Mr. Jackson said of the housing correction. "The stress in housing is significant, the stress in automotive retail is significant."
Bear Stearns Seizes Hedge Fund Assets
by Calculated Risk on 7/26/2007 05:41:00 PM
From the WSJ: Bear Stearns Seizes Hedge Fund Assets
The parent company has assumed ownership of the remaining assets ... in the High-Grade Structured Credit Strategies Fund. Those assets will now be hedged by Bear's trading team and likely sold when their values seem more attractive, says a person close to the situation.The High-Grade fund was the less levered fund, so I suppose this means both funds are (or will be) shut-down.
Predict Existing Home Sales Contest
by Calculated Risk on 7/26/2007 02:06:00 PM
If anyone missed the post yesterday, we are having a contest to predict Existing Home sales for 2007 (to be announced in January '08). Please post your predictions in the comments to the contest post: Contest: Forecast 2007 Existing Home Sales
As food for thought, here is an excerpt from a Goldman Sachs piece yesterday: How Much More Downside for Housing Activity?
Today’s comment assesses how far the US housing downturn has progressed, relative to historically “typical” trough levels for both housing starts and existing home sales. If we are on our way to such a “typical” trough, both indicators would have significantly further to fall, from a current 1.47 million to 1.1 million in the case of housing starts and—more dramatically—from 5.75 million to 3.6 million in the case of existing home sales.
Even though our housing views have long been on the bearish side, these figures are well below our baseline forecasts, especially in the case of existing home sales. We do believe these “typical trough” results are probably too pessimistic, mainly because of structural improvements in the workings of the housing and mortgage markets compared with the 1970s and 1980s. However, the recent upheavals in the mortgage finance industry have made us less confident on this score.
Excerpted with permission.
Wells Fargo to Close Non-Prime Wholesale Lending Business
by Calculated Risk on 7/26/2007 12:40:00 PM

Click on photo for larger image.
Wells Fargo Closes Nonprime Wholesale Lending Business
Wells Fargo Home Mortgage, a division of Wells Fargo Bank, N.A., said today that it will close its nonprime wholesale lending business, which processes and funds nonprime loans for third-party mortgage brokers. In 2006, this business represented 1.6 percent of Wells Fargo's total residential mortgage loan volume of $397.6 billionJPMorgan also tightened mortgage lending standards today too. From JPMorgan:
Will require an initial fixed rate for at least five years on adjustable-rate mortgages for non-prime borrowers to reduce payment shock risk
Will employ underwriting guidelines that require borrowers to demonstrate their ability to handle increases in interest rates on non-traditional mortgages
Has tightened credit standards, including making adjustments to acknowledge declining home values in certain markets and reducing the use of high loan-to-value ratios and stated-income products
Will continue to consider borrowers’ required property tax and homeowners’ insurance payments in determining affordability. Chase offers all its borrowers an option to escrow those payments with Chase
Will continue its practice of not offering option ARMs, which can expose borrowers to negative amortization when their monthly payment does not cover interest costs
More on June New Home Sales
by Calculated Risk on 7/26/2007 11:07:00 AM
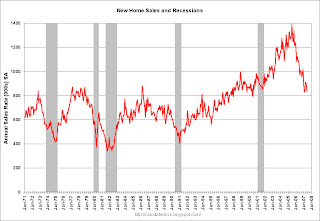
For more graphs, please see my earlier post: June New Home Sales Click on graph for larger image.
The first graph shows New Home Sales vs. Recession for the last 35 years. New Home sales were falling prior to every recession, with the exception of the business investment led recession of 2001. This should raise concerns about a possible consumer led recession in the months ahead.
The second graph compares annual New Home Sales vs. Not Seasonally Adjusted (NSA) New Home Sales through June.
Typically, for an average year, about 52% of all new home sales happen before the end of June. Therefore the scale on the right is set to 52% of the left scale.
At the current pace, new home sales for 2007 will probably be in the high 800 thousands - about the same level as in 1998 through 2000. This is significantly below the forecasts of even many bearish forecasters.
If sales slow in the 2nd half of 2007 - as I expect - New Home sales might be in the low 800s - the lowest level since 1997.
June New Home Sales
by Calculated Risk on 7/26/2007 10:00:00 AM
According to the Census Bureau report, New Home Sales in June were at a seasonally adjusted annual rate of 834 thousand. Sales for May were revised down significantly to 893 thousand, from 930 thousand. Numbers for April were also revised down. 
Click on Graph for larger image.
Sales of new one-family houses in June 2007 were at a seasonally adjusted annual rate of 834,000 ... This is 6.6 percent below the revised May rate of 893,000 and is 22.3 percent below the June 2006 estimate of 1,073,000..
The Not Seasonally Adjusted monthly rate was 77,000 New Homes sold. There were 98,000 New Homes sold in June 2006.
June '07 sales were the lowest June since 2000 (71,000).
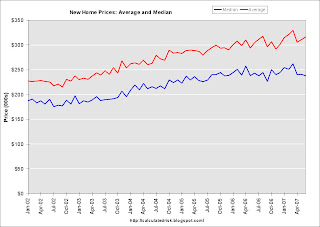
The median and average sales prices were mixed. Caution should be used when analyzing monthly price changes since prices are heavily revised and do not include builder incentives.
The median sales price of new houses sold in June 2007 was $237,900; the average sales price was $316,200.
The seasonally adjusted estimate of new houses for sale at the end of June was 537,000.
The 537,000 units of inventory is slightly below the levels of the last year. Inventory for the previous months were revised up slightly.
Inventory numbers from the Census Bureau do not include cancellations - and cancellations are once again at record levels. Actual New Home inventories are probably much higher than reported - some estimate are about 20% higher.
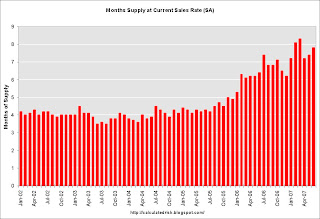
This represents a supply of 7.8 months at the current sales rate.
It appears we are back to were sales are being revised down every month. As I noted last month, this probably indicates another downturn in the market. More later today on New Home Sales.


