by Calculated Risk on 1/11/2009 10:44:00 AM
Sunday, January 11, 2009
Christina Romer Explains Stimulus Plan
Christina Romer, the Chair-designate for the Council of Economic Advisers talks about the stimulus plan ...
Saturday, January 10, 2009
The Obama Stimulus Plan
by Calculated Risk on 1/10/2009 04:43:00 PM
| Here is an outline of the Obama Plan (not much detail): The Job Impact of American Recovery and Reinvestment Plan Click on graph for larger image in new window. |  |
Morgan Stanley May Pay $3 Billion for Smith Barney Interest
by Calculated Risk on 1/10/2009 09:25:00 AM
From Bloomberg: Morgan Stanley May Pay Citigroup $3 Billion in Brokerage Merger
Morgan Stanley may pay Citigroup Inc. as much as $3 billion for control of a venture that would combine their brokerage units ... Morgan Stanley ... may get 51 percent of the new company and an option to acquire the rest over three to five years ... The transaction may be announced as soon as tomorrow, the person said.Just shuffling the TARP money ...
Citigroup ... would get cash for its Smith Barney brokerage, while Morgan Stanley would get recurring fee revenue and more potential banking customers.
Friday, January 09, 2009
Office Investment
by Calculated Risk on 1/09/2009 10:38:00 PM
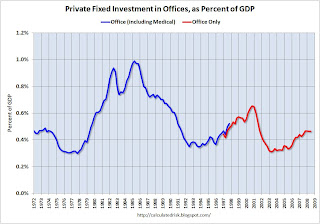
Just to put the coming office space bust in perspective, here are two graphs that show the amount of investment in office space in the U.S. Click on graph for larger image in new window.
The first graph shows the amount of office space delivered per year in the U.S. in millions of square feet since 1958. The over investment during the '80s (S&L crisis) is obvious, as is the office boom during the stock bubble.
The red columns are based on projections from Costar for projects already in the pipeline. The second graph shows office investment as a percent of GDP since 1972. Office investment increased slightly in Q3 2008 in nominal dollars, but decreased slightly as a percent of GDP.
NOTE: In 1997, the Bureau of Economic Analysis changed the office category. In the earlier years, offices included medical offices. After '97, medical offices were not included (The BEA presented the data both ways in '97).
Although I expect a significant decline in office investment over the next few years, the good news is the current boom wasn't anywhere near as large as the previous booms - so hopefully the bust will not be as bad as the early '90s.
Automaker Pensions Underfunded
by Calculated Risk on 1/09/2009 07:11:00 PM
From the WSJ: Agency Raises Concerns About Car Makers' Pensions
The head of the U.S. Pension Benefit Guaranty Corp. acknowledged in an interview that General Motors Corp., Ford Motor Co., and Chrysler LLC have well funded pensions according to the standard accounting rules applied by the Securities and Exchange Commission.The PBGC is another bailout waiting to happen.
But by the PBGC's measures, the pension funds of Detroit's Big Three would be underfunded by as much as $41 billion ...
[PBGC Director Charles E. F. Millard] estimates that the three auto makers only have enough money in their pension funds to cover only 76% of the pension obligations they have made, if they terminate the pension plans. GM's plan is estimated to be $20 billion, or about 20% underfunded, while Chrysler's plan is 34% underfunded, leading to a $9 billion-plus shortfall, the agency said. Ford's funded ratio is not publicly available, but the company's pension plans are likely running at a $12 billion deficit.
About $13 billion of the estimated $41 billion shortfall would be covered by the PBGC ...
The Residential Rental Market
by Calculated Risk on 1/09/2009 02:47:00 PM
Yesterday I linked to an article in the Los Angeles Times about declining residential rents: Housing downturn hits L.A.-area rents
There are several different factors impacting rental supply and demand - and therefore rents - for residential properties.
First, there has been a significant shift away from homeownership: Click on graph for larger image in new window.
The homeownership rate decreased slightly to 67.9% in Q3 2008 (most recent data) and is now back to the levels of the summer of 2001. Note: graph starts at 60% to better show the change.
This would suggest a rising demand for rental properties.
Second, a large number of homes are now sitting vacant: This graph shows the homeowner vacancy rate. A normal rate for recent years appears to be about 1.7%.
The recent surge in homeowner vacancy rates is probably due to foreclosures and other distressed properties. Many REOs (lender Real Estate Owned) are left vacant until sold, and this has taken a number of housing units off the market.
Note that Fannie and Freddie have proposed a new program to keep tenants in foreclosed properties, but so far the standard lender practice is to evict tenants after foreclosure and let the house sit vacant.
So the first two graphs might suggest rising rents. Demand was rising as households moved from homeownership to renting, and the overall available supply of housing units was declining as many REOs were left vacant. And in fact, rents have been rising in many areas until now, from the LA Times story:
Nationwide, apartment rents eased 0.1% in the fourth quarter, the first drop since 2002, according to the analysis by research firm Reis Inc. ... according to [REIS] apartment rents fell in 54 out of 79 U.S. metropolitan areas in the fourth quarter of 2008.However the supply of rental units has been surging:
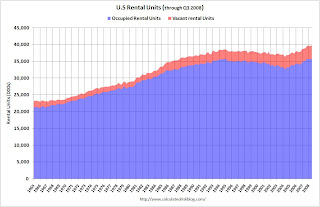
 This graph shows the number of occupied (blue) and vacant (red) rental units in the U.S. (all data from the Census Bureau).
The total number of rental units (red and blue) bottomed in Q2 2004, and started climbing again. Since Q2 2004, there have been almost 3.5 million units added to the rental inventory. This increase in units almost offset the recent strong migration from ownership to renting, so the rental vacancy rate has only declined slightly (from a peak of 10.4% in 2004 to 9.9% in the most recent quarter).
Where did these 3.5 rental units come from?
The Census Bureau's Housing Units Completed, by Intent and Design shows 1.05 million units completed as 'built for rent' since Q2 2004. This means that another 2.5 million rental units came from conversions from ownership to rentals.
These could be investors buying REOs for cash flow, older out-of-service units being brought back to the rental market, condo "reconversions", builders changing the intent of new construction (started as condos but became rentals), flippers becoming landlords, or homeowners renting their previous homes instead of selling.
Note: it is also common in a recession for apartment vacancies to rise as households double up by moving in with a friends or family members.
Although there are several factors increasing the supply, I believe the surge in REO sales to cash flow investors is having a significant impact on rents. Many of those vacant homeowner units are being converted to rental properties - although this isn't showing up in the Census Bureau data yet (something to watch for).
And falling or flat rents will lead to lower house prices too. Here is a graph of the price-to-rent ratio using the Case-Shiller house price index through Q3 2008 and the Owners' Equivalent Rent (OER) from the BLS.
 Looking at the price-to-rent ratio based on the Case-Shiller index, the adjustment in the price-to-rent ratio is probably 60% to 70% complete as of Q3 2008 on a national basis.
 However flat or falling rents would suggest even larger future house price declines to return to normal (as opposed to rising rents).
Boeing to Cut 4,500 Jobs
by Calculated Risk on 1/09/2009 01:52:00 PM
From Bloomberg: Boeing Cuts 4,500 Commercial Jobs as Economy Weakens
Boeing Co., the world’s second-largest commercial-plane maker, plans to cut about 4,500 jobs this year to reduce costs as the global economy weakens, hurting demand for new aircraft.The bad employment news just keeps coming.
...
The company yesterday said it had net orders for 662 planes in 2008, down from 1,413 one year earlier.
Over 8 Million Part Time Workers
by Calculated Risk on 1/09/2009 09:01:00 AM
From the BLS report:
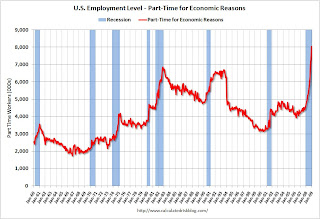
In December, the number of persons who worked part time for economic reasons (some-times referred to as involuntary part-time workers) continued to increase, reaching 8.0 million. The number of such workers rose by 3.4 million over the past 12 months. This category includes persons who would like to work full time but were working part time because their hours had been cut back or because they were unable to find full-time jobs.
 Click on graph for larger image.
Not only has the unemployment rate risen sharply to 7.2%, but the number of workers only able to find part time jobs (or have had their hours cut for economic reasons) is now over 8 million.
Of course the U.S. population is significantly larger today (about 305 million) than in the early '80s (about 228 million) when the number of part time workers almost reached 7 million, but the rapid increase in part time workers is pretty stunning.
Employment Declines Sharply, Unemployment Rises to 7.2 Percent
by Calculated Risk on 1/09/2009 08:30:00 AM
From the BLS:
Nonfarm payroll employment declined sharply in December, and the unemployment rate rose from 6.8 to 7.2 percent, the Bureau of Labor Statistics of the U.S. Department of Labor reported today. Payroll employment fell by 524,000 over the month and by 1.9 million over the last 4 months of 2008. In December, job losses were large and widespread across most major industry sectors.
 Click on graph for larger image.
This graph shows the unemployment rate and the year over year change in employment vs. recessions.
Nonfarm payrolls decreased by 524,00 in December, and November payrolls were revised down to a loss of 584,000 jobs. The economy has lost over 1.5 million jobs over the last 3 months alone!
The unemployment rate rose to 7.2 percent; the highest level since January 1993.
Year over year employment is now strongly negative (there were 2.6 million fewer Americans employed in Dec 2008 than in Dec 2007). This is another extremely weak employment report ...
Office Vacancy Rates Rising
by Calculated Risk on 1/09/2009 12:17:00 AM
First, a few articles:
From the Seattle Times: Downtown office markets may soon see vacancy rates in the teens
Vacancy rates in the two downtowns will climb well into the teens this year as companies downsize and new office buildings — some still lacking even a single signed tenant — come on line, according to new reports from brokerages Cushman & Wakefield and Grubb & Ellis.From the IndyStar.com: Indy office vacancy rate is highest since '04
The office vacancy rate in the Indianapolis area hit 19.5 percent at year end, a fraction of a percent higher than in the third quarter.From the Austin Business Journal: Austin office vacancy hits 19%
The vacancy rate is the highest since at least 2004, says CB Richard Ellis commercial realty in its year-end report.
Six multi-tenant office buildings opened in the metro area last year, which helped boost the overall vacancy rate.
Austin’s overall office vacancy rose to 19 percent in 2008, compared with a 14 percent overall vacancy rate in 2007, according to a report released today by Oxford Commercial. ...Supply is increasing as more office space is being delivered, more companies are subleasing space, and companies are downsizing. Demand is falling (actually negative) as the economy weakens. The following graph is from CoStar Commercial Real Esate The State of the Commercial Real Estate Industry: 2008 Review/2009 Outlook (no link)
An increase in inventory--Austin now has a total of more than 42 million square feet of office space as of the end of 2008, 3.6 million of that delivered in the past 12 months--contributed to the increase in vacancy rates, said Vic Russo, a senior vice president in the Austin brokerage firm’s office division.

Click on graph for larger image in new window.
For the next two years, CoStar is projecting about 110 million square feet of new office space will be delivered per year (over 150 million in 2009!), and they are also projecting negative absorption of about 230 million square feet per year.
This suggests rents will fall sharply for the next couple of years, delinquencies will rise, and new office construction will come to a halt. Although deliveries will be strong in 2009 (with all the projects currently under construction), CoStar projects new office deliveries in 2010 will the lowest since 1996, and deliveries in 2011 will be the lowest in over 50 years.
Definition of Negative Absorption: The absorption rate is the net amount of square feet leased each year. A negative absorption rate means that more companies are downsizing or subleasing space than companies expanding and adding space.
"Negative absorption" are two words no developer ever wants to hear.


