by Calculated Risk on 1/11/2009 02:37:00 PM
Sunday, January 11, 2009
Demolition as Stimulus
Last year I noted that there weren't anywhere near enough shovel ready public projects to even offset the expected decline in non-residential structure investment in 2009 - much less make up for the declines in residential construction employment and other areas of job losses.
In May of 2008, I estimated the decrease in non-residential investment for malls, offices and lodging alone at about $60 billion. This is far greater than the $18.4 billion estimate of shovel ready projects from The American Association of State Highway and Transportation Officials.
As the Obama team has noted, properly chosen infrastructure projects provide the best bang for the buck. These projects provide jobs today, and they are an investment in the future. We need more projects ...
And since Obama asked for suggestions ... How about a demolition program?
First, if any state and local governments have old idle buildings waiting for future plans, why not demolish them today? This would provide jobs for local workers, and prepare the land for future development and remove an eyesore. The Federal Government could pay for this demolition.
Second, how about a tax credit for demolishing residential housing units? In many areas there are old, vacant housing units. These are a public nuisance, but the owners have no motivation to demolish the property. Why not provide a tax credit if the properties are demolished in 2009? This could eliminate housing units from the housing stock, provide local jobs, and possibly remove a public nuisance.
A demolition plan would probably only add a few billion to the stimulus package, but it would be well targeted providing jobs in many communities and prepare the land for renewed growth in the future.
Just my 2 cents ...
Trucking Quote of the Day
by Calculated Risk on 1/11/2009 01:17:00 PM
"We have this trucking survey, and it went down to almost eight this week. [the index is 0 to 100 with 50 being normal] ... This is suicidal on that particular survey which is highly correlated to the economy."ISI Chairman Ed Hyman (no link)
Christina Romer Explains Stimulus Plan
by Calculated Risk on 1/11/2009 10:44:00 AM
Christina Romer, the Chair-designate for the Council of Economic Advisers talks about the stimulus plan ...
Saturday, January 10, 2009
The Obama Stimulus Plan
by Calculated Risk on 1/10/2009 04:43:00 PM
| Here is an outline of the Obama Plan (not much detail): The Job Impact of American Recovery and Reinvestment Plan Click on graph for larger image in new window. |  |
Morgan Stanley May Pay $3 Billion for Smith Barney Interest
by Calculated Risk on 1/10/2009 09:25:00 AM
From Bloomberg: Morgan Stanley May Pay Citigroup $3 Billion in Brokerage Merger
Morgan Stanley may pay Citigroup Inc. as much as $3 billion for control of a venture that would combine their brokerage units ... Morgan Stanley ... may get 51 percent of the new company and an option to acquire the rest over three to five years ... The transaction may be announced as soon as tomorrow, the person said.Just shuffling the TARP money ...
Citigroup ... would get cash for its Smith Barney brokerage, while Morgan Stanley would get recurring fee revenue and more potential banking customers.
Friday, January 09, 2009
Office Investment
by Calculated Risk on 1/09/2009 10:38:00 PM
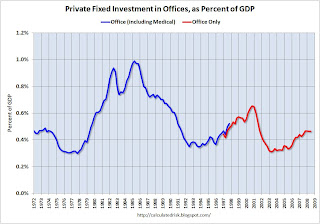
Just to put the coming office space bust in perspective, here are two graphs that show the amount of investment in office space in the U.S. Click on graph for larger image in new window.
The first graph shows the amount of office space delivered per year in the U.S. in millions of square feet since 1958. The over investment during the '80s (S&L crisis) is obvious, as is the office boom during the stock bubble.
The red columns are based on projections from Costar for projects already in the pipeline. The second graph shows office investment as a percent of GDP since 1972. Office investment increased slightly in Q3 2008 in nominal dollars, but decreased slightly as a percent of GDP.
NOTE: In 1997, the Bureau of Economic Analysis changed the office category. In the earlier years, offices included medical offices. After '97, medical offices were not included (The BEA presented the data both ways in '97).
Although I expect a significant decline in office investment over the next few years, the good news is the current boom wasn't anywhere near as large as the previous booms - so hopefully the bust will not be as bad as the early '90s.
Automaker Pensions Underfunded
by Calculated Risk on 1/09/2009 07:11:00 PM
From the WSJ: Agency Raises Concerns About Car Makers' Pensions
The head of the U.S. Pension Benefit Guaranty Corp. acknowledged in an interview that General Motors Corp., Ford Motor Co., and Chrysler LLC have well funded pensions according to the standard accounting rules applied by the Securities and Exchange Commission.The PBGC is another bailout waiting to happen.
But by the PBGC's measures, the pension funds of Detroit's Big Three would be underfunded by as much as $41 billion ...
[PBGC Director Charles E. F. Millard] estimates that the three auto makers only have enough money in their pension funds to cover only 76% of the pension obligations they have made, if they terminate the pension plans. GM's plan is estimated to be $20 billion, or about 20% underfunded, while Chrysler's plan is 34% underfunded, leading to a $9 billion-plus shortfall, the agency said. Ford's funded ratio is not publicly available, but the company's pension plans are likely running at a $12 billion deficit.
About $13 billion of the estimated $41 billion shortfall would be covered by the PBGC ...
The Residential Rental Market
by Calculated Risk on 1/09/2009 02:47:00 PM
Yesterday I linked to an article in the Los Angeles Times about declining residential rents: Housing downturn hits L.A.-area rents
There are several different factors impacting rental supply and demand - and therefore rents - for residential properties.
First, there has been a significant shift away from homeownership: Click on graph for larger image in new window.
The homeownership rate decreased slightly to 67.9% in Q3 2008 (most recent data) and is now back to the levels of the summer of 2001. Note: graph starts at 60% to better show the change.
This would suggest a rising demand for rental properties.
Second, a large number of homes are now sitting vacant: This graph shows the homeowner vacancy rate. A normal rate for recent years appears to be about 1.7%.
The recent surge in homeowner vacancy rates is probably due to foreclosures and other distressed properties. Many REOs (lender Real Estate Owned) are left vacant until sold, and this has taken a number of housing units off the market.
Note that Fannie and Freddie have proposed a new program to keep tenants in foreclosed properties, but so far the standard lender practice is to evict tenants after foreclosure and let the house sit vacant.
So the first two graphs might suggest rising rents. Demand was rising as households moved from homeownership to renting, and the overall available supply of housing units was declining as many REOs were left vacant. And in fact, rents have been rising in many areas until now, from the LA Times story:
Nationwide, apartment rents eased 0.1% in the fourth quarter, the first drop since 2002, according to the analysis by research firm Reis Inc. ... according to [REIS] apartment rents fell in 54 out of 79 U.S. metropolitan areas in the fourth quarter of 2008.However the supply of rental units has been surging:
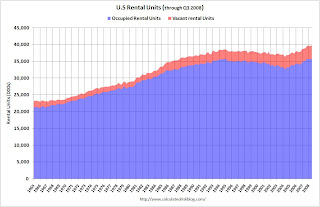
 This graph shows the number of occupied (blue) and vacant (red) rental units in the U.S. (all data from the Census Bureau).
The total number of rental units (red and blue) bottomed in Q2 2004, and started climbing again. Since Q2 2004, there have been almost 3.5 million units added to the rental inventory. This increase in units almost offset the recent strong migration from ownership to renting, so the rental vacancy rate has only declined slightly (from a peak of 10.4% in 2004 to 9.9% in the most recent quarter).
Where did these 3.5 rental units come from?
The Census Bureau's Housing Units Completed, by Intent and Design shows 1.05 million units completed as 'built for rent' since Q2 2004. This means that another 2.5 million rental units came from conversions from ownership to rentals.
These could be investors buying REOs for cash flow, older out-of-service units being brought back to the rental market, condo "reconversions", builders changing the intent of new construction (started as condos but became rentals), flippers becoming landlords, or homeowners renting their previous homes instead of selling.
Note: it is also common in a recession for apartment vacancies to rise as households double up by moving in with a friends or family members.
Although there are several factors increasing the supply, I believe the surge in REO sales to cash flow investors is having a significant impact on rents. Many of those vacant homeowner units are being converted to rental properties - although this isn't showing up in the Census Bureau data yet (something to watch for).
And falling or flat rents will lead to lower house prices too. Here is a graph of the price-to-rent ratio using the Case-Shiller house price index through Q3 2008 and the Owners' Equivalent Rent (OER) from the BLS.
 Looking at the price-to-rent ratio based on the Case-Shiller index, the adjustment in the price-to-rent ratio is probably 60% to 70% complete as of Q3 2008 on a national basis.
 However flat or falling rents would suggest even larger future house price declines to return to normal (as opposed to rising rents).
Boeing to Cut 4,500 Jobs
by Calculated Risk on 1/09/2009 01:52:00 PM
From Bloomberg: Boeing Cuts 4,500 Commercial Jobs as Economy Weakens
Boeing Co., the world’s second-largest commercial-plane maker, plans to cut about 4,500 jobs this year to reduce costs as the global economy weakens, hurting demand for new aircraft.The bad employment news just keeps coming.
...
The company yesterday said it had net orders for 662 planes in 2008, down from 1,413 one year earlier.
Over 8 Million Part Time Workers
by Calculated Risk on 1/09/2009 09:01:00 AM
From the BLS report:
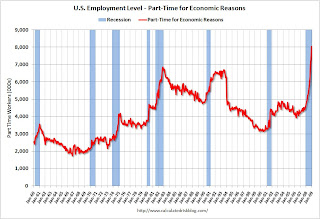
In December, the number of persons who worked part time for economic reasons (some-times referred to as involuntary part-time workers) continued to increase, reaching 8.0 million. The number of such workers rose by 3.4 million over the past 12 months. This category includes persons who would like to work full time but were working part time because their hours had been cut back or because they were unable to find full-time jobs.
 Click on graph for larger image.
Not only has the unemployment rate risen sharply to 7.2%, but the number of workers only able to find part time jobs (or have had their hours cut for economic reasons) is now over 8 million.
Of course the U.S. population is significantly larger today (about 305 million) than in the early '80s (about 228 million) when the number of part time workers almost reached 7 million, but the rapid increase in part time workers is pretty stunning.


