by Calculated Risk on 1/31/2009 01:44:00 AM
Saturday, January 31, 2009
January Economic Summary in Graphs
Here is a collection of 20 real estate and economic graphs from January ... New Home Sales in December
Click on graph for larger image in new window.
The first graph shows monthly new home sales (NSA - Not Seasonally Adjusted).
Notice the Red columns for 2008. This is the lowest sales for December since 1966. (NSA, 23 thousand new homes were sold in December 2008, 23 thousand were sold in December 1966). As the graph indicates, sales in 2008 are substantially worse than the previous years. From: Record Low New Homes Sales in December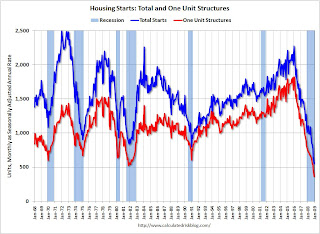 Housing Starts in December
Total housing starts were at 550 thousand (SAAR) in December, by far the lowest level since the Census Bureau began tracking housing starts in 1959.
Single-family starts were at 398 thousand in December; also the lowest level ever recorded (since 1959). Single-family permits were at 363 thousand in December, suggesting single family starts may fall even further next month. From: Housing Starts at All Time Low 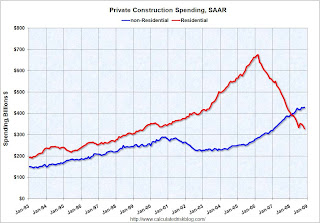 Construction Spending in November
This graph shows private residential and nonresidential construction spending since 1993.
Nonresidential spending held up as builders completed projects. This showed up in the Q4 GDP report too (non-residential investment in structures was off only slightly in Q4). From: Construction Spending Declines in November Strip Mall Vacancy Rate
REIS reported: "At neighborhood and community shopping centers, the vacancy rate rose to 8.9 percent from 8.4 percent in the third quarter, the highest since Reis began publishing quarterly data in 1999."
This graph shows the strip mall vacancy rate since Q2 2007. Note that the graph doesn't start at zero to better show the change. Strip mall vacancy rates are headed for double digits this year. From: Mall Vacancies Reach 10-Year High  December Employment Report
This graph shows the unemployment rate and the year over year change in employment vs. recessions. The unemployment rate rose to 7.2 percent; the highest level since January 1993.
Nonfarm payrolls decreased by 524,00 in December, and November payrolls were revised down to a loss of 584,000 jobs. The economy lost over 1.5 million jobs in Q4 alone! From: Employment Declines Sharply, Unemployment Rises to 7.2 Percent 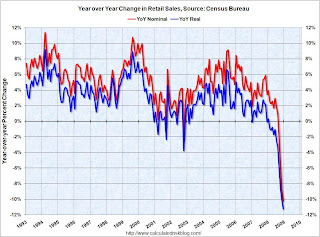 December Retail Sales
This graph shows the year-over-year change in nominal and real retail sales since 1993.
Although the Census Bureau reported that nominal retail sales decreased 10.2% year-over-year (retail and food services decreased 9.8%), real retail sales declined by 11.3% (on a YoY basis). This is the largest YoY decline since the Census Bureau started keeping data. From: Retail Sales Collapse in December  LA Port Traffic in December
This graph shows the combined loaded inbound and outbound traffic at the ports of Long Beach and Los Angeles in TEUs (TEUs: 20-foot equivalent units or 20-foot-long cargo container).
Inbound traffic was 19% below last December. For the LA area ports, outbound traffic continued to decline in December, and was 30% below the level of December 2007. From: LA Area Port Traffic Collapses in December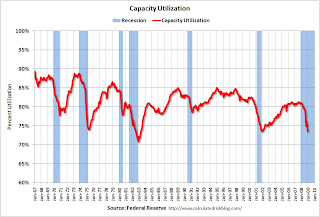 December Capacity Utilization
Capacity utilization fell to 73.6% from 75.2%. This is the lowest level since December 2001.
The significant decline in capacity utilization suggests less investment in non-residential structures for some time. From: Capacity Utilization and Industrial Production Cliff Diving  Vehicle Sales
This graph shows monthly vehicle sales (autos and trucks) as reported by the BEA at a Seasonally Adjusted Annual Rate (SAAR).
This shows that sales have plunged to just over a 10 million annual rate - the lowest rate since the early '80s recession. From: Vehicle Sales NAHB Builder Confidence Index in January
This graph shows the builder confidence index from the National Association of Home Builders (NAHB).
The builder confidence index was at 8 in January, a new record low. From: NAHB Housing Market Index Falls to New Record Low  Architecture Billings Index for December
The American Institute of Architects (AIA) reported the December ABI rating was 36.4, up from the 34.7 mark in November (any score above 50 indicates an increase in billings).
From: Architecture Billings Index Near Record Low Vehicle Miles driven in November
This graph shows the annual change in the rolling 12 month average of U.S. vehicles miles driven. Note: the rolling 12 month average is used to remove noise and seasonality.
By this measure, vehicle miles driven are off a record 3.7% Year-over-year (YoY); the decline in miles driven is worse than during the early '70s and 1979-1980 oil crisis. As the DOT noted, miles driven in November 2008 were 5.4% less than November 2007, so the YoY change in the rolling average may get worse. From: DOT: U.S. Vehicle Miles Driven Declines Sharply Existing Home Sales in December
This graph shows existing home sales, on a Seasonally Adjusted Annual Rate (SAAR) basis since 1993.
Sales in December 2008 (4.74 million SAAR) were 6.5% higher than last month, and were 3.5% lower than December 2007 (4.91 million SAAR). From: Existing Home Sales Increase in December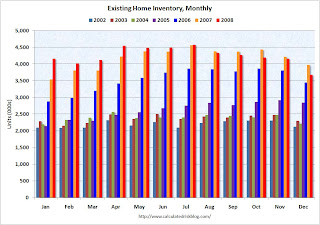 Existing Home Inventory
This graph shows inventory by month starting in 2002. Inventory levels were flat for years (during the bubble), but started increasing at the end of 2005.
Inventory levels increased sharply in 2006 and 2007, but have been close to 2007 levels for most of 2008. In fact inventory for the last five months was below the levels of last year. This might indicate that inventory levels are close to the peak for this cycle. From: Existing Home Sales (NSA)  Case Shiller House Prices for November
This graph shows the nominal Composite 10 and Composite 20 indices (the Composite 20 was started in January 2000).
The Composite 10 index is off 26.6% from the peak. The Composite 20 index is off 25.1% from the peak. From: Case-Shiller: House Prices Fall Sharply in November 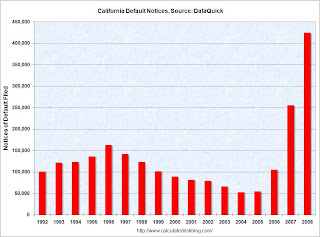 California Notices of Default
This graph shows the Notices of Default (NOD) by year in California from DataQuick.
There were a record 423,962 NODs filed in 2008, breaking the old record of 254,824 NODs in 2007.
The previous record had been in 1996 with 162,678 NODs filed. That was during the previous California housing bust in the early to mid-90s. From: DataQuick: Temporary Drop in California Foreclosure Activity ATA Truck Tonnage Index
"The American Trucking Associations’ advanced seasonally adjusted For-Hire Truck Tonnage Index plunged 11.1 percent in December 2008, marking the largest month-to-month reduction since April 1994, when the unionized less-than-truckload industry was in the midst of a strike. December’s drop was the third-largest single-month drop since ATA began collecting the data in 1973." From: Truck Tonnage Index: Cliff Diving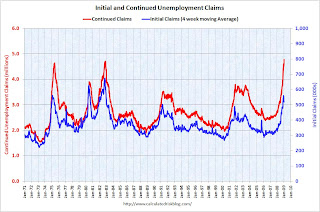 Unemployment Claims
This graph shows weekly claims and continued claims since 1971.
The four week moving average is at 542,500; still below the recent peak of 558,750
in December.
Continued claims are now at 4.78 million - a new record (not adjusted for population) - just above the previous all time peak of 4.71 million in 1982. From: Continued Unemployment Claims at Record High  Restaurant Performance Index for December
"The Association's Restaurant Performance Index (RPI) - a monthly composite index that tracks the health of and outlook for the U.S. restaurant industry - stood at 96.4 in December, down 0.2 percent from November and its 14th consecutive month below 100."
From: Restaurant Performance Index at New Low New Home Sales
This graph shows New Home Sales vs. recessions for the last 45 years. New Home sales have fallen off a cliff.
From: Record Low New Homes Sales in December
How I Learned to Stop Worrying and Love the TARP
by Calculated Risk on 1/31/2009 12:41:00 AM
Remember Dr. Evil and Mini-Me? Here is another one ... (hat tip bentway, Chancels)
Click on photo for larger image in new window.
Does Treasury Secretary Tim Geithner look like Peter Sellers in Dr. Strangelove?
Maybe ...
Friday, January 30, 2009
Four Bad Bears: January Update
by Calculated Risk on 1/30/2009 08:47:00 PM
After the excellent stock market returns in January (just kidding - actually the worst January ever), it is probably time to check in on the Four Bad Bear markets ... first, from MarketWatch: U.S. stocks end worst January on record with more losses
The S&P 500 index fell 19 points, or 2.3%, to 825. For the month, the broad index fell 8.6%, its worst performance on record.
This graph is from Doug Short of dshort.com (financial planner): "Four Bad Bears". There is much more at the site.
Doug has added the market recoveries (light red and green) for the 1970s and early 2000s bear markets.
Note that the Great Depression crash is based on the DOW; the three others are for the S&P 500.
Frontline: Inside the Meltdown
by Calculated Risk on 1/30/2009 08:05:00 PM
This might be interesting. It is on PBS on February 17th (this is a 1 min 22 sec preview):
2009 Bank Failures 5 and 6
by Calculated Risk on 1/30/2009 06:30:00 PM
From the FDIC: Bank of Essex, Tappahannock, Virginia, Acquires All the Deposits of Suburban Federal Savings Bank, Crofton, Maryland
Suburban Federal Savings Bank, Crofton, Maryland, was closed today by the Office of Thrift Supervision, and the Federal Deposit Insurance Corporation (FDIC) was named receiver. To protect the depositors, the FDIC entered into a purchase and assumption agreement with Bank of Essex, Tappahannock, Virginia, to assume all of the deposits of Suburban Federal.And #6 from the FDIC: CenterState Bank Acquires All the Deposits of Ocala National Bank, Ocala, Florida
...
As of September 30, 2008, Suburban Federal had total assets of approximately $360 million and total deposits of $302 million. In addition to assuming all of the failed bank's deposits, Bank of Essex agreed to purchase approximately $348 million in assets at a discount of $45 million. The FDIC will retain the remaining assets for later disposition.
...
The FDIC estimates that the cost to the Deposit Insurance Fund will be $126 million. Bank of Essex's acquisition of all deposits was the "least costly" resolution for the FDIC's Deposit Insurance Fund compared to alternatives. Suburban Federal is the fifth bank to fail in the nation this year. The last bank to be closed in Maryland was Second National Federal Savings Bank, Salisbury, on December 4, 1992.
Ocala National Bank, Ocala, Florida, was closed today by the Office of the Comptroller of the Currency, and the Federal Deposit Insurance Corporation (FDIC) was named receiver. To protect the depositors, the FDIC entered into a purchase and assumption agreement with CenterState Bank of Florida, Winter Haven, Florida, to assume all of the deposits of the Ocala National Bank.Three down today, more to come?
...
As of December 31, 2008, Ocala National Bank had total assets of $223.5 million and total deposits of $205.2 million. In addition to assuming all of the failed bank's deposits for a premium of 1.7 percent, CenterState agreed to purchase approximately $23.5 million in assets. The FDIC will retain the remaining assets for later disposition.
...
The transaction is the least costly resolution option, and the FDIC estimates the cost to its Deposit Insurance Fund will be $99.6 million. Ocala National is the sixth FDIC-insured institution to be closed this year. Ocala National Bank is the first bank to fail in Florida since Freedom Bank, Bradenton, on October 31, 2008.
Update: Friday Failure Haiku
TodayBank of Essex saves the day
Are there more to come?
Florida bank toast
Ocala, rhymes like Orange?
Asset base has burnt
by Soylent Green is People.
2009 Bank Failure #4: MagnetBank, Salt Lake City, Utah
by Calculated Risk on 1/30/2009 05:13:00 PM
Note: DCRogers points out in the comments that this is mostly an Atlanta area bank. From the Atlanta Business Chronicle in Nov 2008: Troubled Magnet Bank looking to raise capital
... a cease-and-desist order jointly issued Oct. 1 by the Federal Deposit Insurance Corp. ... The Salt Lake City-based bank was founded by an Atlanta investor group and retains much of its operations in Atlanta and Raleigh, N.C., offices. ... Magnet opened in 2005 and grew as home construction lending exploded.From the FDIC: FDIC Approves the Payout of the Insured Deposits of MagnetBank, Salt Lake City, Utah
The Federal Deposit Insurance Corporation (FDIC) approved the payout of the insured deposits of MagnetBank, Salt Lake City, Utah. The bank was closed today by the Utah Department of Financial Institutions and the FDIC was named receiver.It is Friday. Probably more to come ...
After an extensive marketing process, the FDIC was unable to find another financial institution to take over the banking operations of MagnetBank. ...
MagnetBank, as of December 2, 2008, had total assets of $292.9 million and total deposits of $282.8 million. It is estimated that the bank did not have any uninsured funds.
...
MagnetBank is the fourth FDIC-insured institution to fail this year and the first in Utah since Bank of Ephraim, was closed on June 25, 2004.
Update: Friday Failure Haiku
Failure on Friday is here
Their loss is ours now.
by Soylent Green is People.
Restaurant Performance Index at New Low
by Calculated Risk on 1/30/2009 02:55:00 PM
Note: This is a new "record low", but the index has only been compiled since 2002, so this is the first recession for the index.
From the National Restaurant Association (NRA): Restaurant Industry Outlook Softens as the Restaurant Performance Index Fell to a Record Low in December
The outlook for the restaurant industry continued to weaken in December, as the National Restaurant Association's comprehensive index of restaurant activity fell to another record low. The Association's Restaurant Performance Index (RPI) - a monthly composite index that tracks the health of and outlook for the U.S. restaurant industry - stood at 96.4 in December, down 0.2 percent from November and its 14th consecutive month below 100.
The December decline in the Restaurant Performance Index was the result of a drop in the current situation component. Same-store sales results were the softest in the history of the Restaurant Performance Index, with nearly two-thirds of restaurant operators reporting lower sales in December.
...
Capital spending activity in the restaurant industry deteriorated along with sales and traffic in recent months. Thirty-four percent of operators said they made a capital expenditure for equipment, expansion or remodeling during the last three months, the lowest level on record.
 Click on graph for larger image in new window.
Unfortunately the data for this index only goes back to 2002.
The index values above 100 indicate a period of expansion; index values below 100 indicate a period of contraction.
Based on this indicator, the restaurant industry has been contracting since November 2007.
Simon: New Mall Construction "Dead for a decade"
by Calculated Risk on 1/30/2009 02:04:00 PM
From Bloomberg: Simon Falls on Plan to Pay Part of Dividend in Stock (hat tip Sam)
David Simon [Chief Executive Officer, Simon Property Group Inc., the biggest U.S. shopping mall owner] ... said the company doesn’t plan to begin construction on new projects or major redevelopments in 2009 and there will be little new U.S. retail construction for years to come.In Q3, investment in U.S. malls was at a $33 billion annual pace, but that includes renovations (there are always renovations). Still I'd expect mall investment to decline in half or more by the end of 2009. I'll have more on mall investment in a few days (when the supplemental GDP data is released).
“The new development business is dead for a decade,” Simon said on today’s call. “Maybe it’s eight years. Maybe it’s not completely dead. Maybe I’m over-dramatizing it for effect.”
The Rebalancing Continues ...
by Calculated Risk on 1/30/2009 01:22:00 PM
The rebalancing of the U.S. economy is ongoing. The savings rate is rising, consumption is falling, and the trade deficit is declining ... Click on graph for larger image in new window.
The first graph shows Personal Consumption Expenditures (PCE) as a percent of GDP. Note: the graph doesn't start at zero to better show the change.
PCE as a percent of GDP declined to 69.6% in Q4, the lowest level since Q2 2001.
Some analysts think the U.S. will return to the days of Ozzie and Harriet with PCE as a percent of GDP in the low 60s, but I think a decline to around 68% is more likely. Net exports as a percent of GDP has declined sharply to 3.7% of GDP. This is the smallest deficit since the end of the '01 recession.
Since GDP = C + I + G + (X − M), the decline in C is being offset by the improvement in net trade (X - M).
As we all know, I (investment) is declining and some components of investment (like non-residential investment in structures) will decline sharply in 2009. G (government) will increase with the Obama stimulus package, and the goal is to increase G until Investment bottoms out. We will see, but the rebalancing of the U.S. economy that we discussed several years ago is now happening.
Note:
C = Personal Consumption expenditures.
I = Gross private domestic investment.
G = Government consumption expenditures and gross investment.
X = exports
M = imports.
Fannie Mae Extends Eviction Suspension Another Month
by Calculated Risk on 1/30/2009 12:11:00 PM
From Fannie Mae: Fannie Mae Extends Eviction Suspension Another Month (hat tip Bradley)
Fannie Mae (FNM/NYSE) today announced that it will extend its suspension of evictions from Fannie Mae-owned single-family properties through February 28, 2009. The suspension applies to all single-family properties including owner-occupied properties that have been foreclosed upon as well as foreclosed properties occupied by renters.It is usually easier to sell a vacant home, but with the glut of homes on the market, and because the foreclosure is not the fault of the renter, this policy seems to make sense.
The company this month began implementing its National Real Estate Owned (REO) Rental Policy that allows qualified renters in Fannie Mae-owned foreclosed properties to stay in their homes. The new policy applies to renters occupying any type of single-family foreclosed properties at the time Fannie Mae acquires the property. Eligible renters will be offered a new month-to-month lease with Fannie Mae or financial assistance for their transition to new housing should they choose to vacate the property. The properties must meet state laws and local code requirements for a rental property. On behalf of the company, property managers are contacting renters in Fannie Mae-owned foreclosed properties to notify them of their options.


