by Calculated Risk on 11/20/2009 01:43:00 PM
Friday, November 20, 2009
National Survey: Data on Home Buying Financing
Here is some national data on home buyer financing in October. This is from a survey by Campbell Communications (excerpted with permission) released today.
Source: October Trends in Existing Home Sales, a presentation from Campbell/Inside Mortgage Finance Monthly Survey on Real Estate Market Conditions.
Thomas Popik, Campbell Surveys Research Director, highlighted several key trends from the survey in October:
Investor Purchases of REO Are Declining First-Time Homebuyers Largely Support the Market First-Time Homebuyers Dependent on FHA Financing If FHA Guidelines Get Tougher, Look for Large Impact Short Sale Inventory and Transactions Are Booming First-Time Homebuyer Traffic Is Starting to Ease
 Click on graph for larger image in new window.
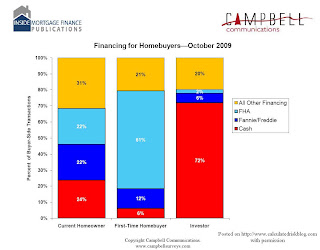
The first chart shows the type of financing used in October.
The cash buyers were mostly investors (frequently buying damaged REOs), and the FHA buyers were mostly first time homebuyers.
The second graph shows the financing breakdown by buyer type.
 According to the survey investors bought 15% of homes in October. About 72% of these purchases were cash.
Current homeowners bought 38% of homes sold in October and used a mix of financing.
First-time homebuyers accounted for 47% of purchases and were mostly buying using FHA insured loans.
Krugman on AIG
by Calculated Risk on 11/20/2009 12:30:00 PM
From Paul Krugman writing in the NY Times: The Big Squander
During the bubble years, many financial companies created the illusion of financial soundness by buying credit-default swaps from A.I.G. — basically, insurance policies in which A.I.G. promised to make up the difference if borrowers defaulted on their debts. It was an illusion because the insurer didn’t have remotely enough money to make good on its promises if things went bad.Krugman argues that government officials have squandered the trust of the American people by treating the financial industry with kid gloves. He argues that this make it more difficult to pass another stimulus packaged focused on job creation.
... by the time A.I.G.’s hollowness became apparent, the world financial system was on the edge of collapse and officials judged — probably correctly — that letting A.I.G. go bankrupt would push the financial system over that edge. So A.I.G. was effectively nationalized; its promises became taxpayer liabilities.
... it seemed only fair for [the financial companies] to bear part of the cost of the bailout, which they could have done by accepting a “haircut” on the amounts A.I.G. owed them. Indeed, the government asked them to do just that. But they said no — and that was the end of the story. Taxpayers not only ended up honoring foolish promises made by other people, they ended up doing so at 100 cents on the dollar.
Unemployment Rate Increases in 29 States in October
by Calculated Risk on 11/20/2009 10:00:00 AM
From the BLS: Regional and State Employment and Unemployment Summary
Twenty-nine states and the District of Columbia recorded over-the-month unemployment rate increases, 13 states registered rate decreases, and 8 states had no rate change, the U.S. Bureau of Labor Statistics reported today. Over the year, jobless rates increased in all 50 states and the District of Columbia.
...
Michigan again recorded the highest unemployment rate among the states, 15.1 percent, in October. The states with the next highest rates were Nevada, 13.0 percent; Rhode Island, 12.9 percent; California, 12.5 percent; and South Carolina, 12.1 percent. The rate in California set a new series high, as did the rates in Delaware (8.7 percent) and Florida (11.2 percent). The District of Columbia also set a series high, 11.9 percent.
emphasis added
 Click on graph for larger image in new window.
This graph shows the high and low unemployment rates for each state (and D.C.) since 1976. The red bar is the current unemployment rate (sorted by the current unemployment rate).
Fourteen states and D.C. now have double digit unemployment rates. New Jersey, Indiana, and Mississippi are all close.
Three states are at record unemployment rates: California, Delaware and Rhode Island. Several others are close.
A Few House Price Forecasts
by Calculated Risk on 11/20/2009 08:55:00 AM
From housing consultant Ivy Zelman commenting on the MBA Delinquency report in the NY Times U.S. Mortgage Delinquencies Reach a Record High
"I’ve been pretty bearish on this big ugly pig stuck in the python and this cements my view that home prices are going back down."From Bloomberg: Housing Recovery in U.S. Set Back to 2010 as Market Wanes
“I don’t think the housing crisis is over,” Mark Zandi, chief economist with Moody’s Economy.com, said in a telephone interview. “I think we’re going to see another leg down.”From Goldman Sachs chief economist Jan Hatzius in a note to clients: A Renewed Sag in the Housing Market (no link)
"Our current working assumption is a 5%-10% drop in home prices through the middle of 2010. ... house prices and credit quality ... to weigh on the US financial system, the availability of bank credit, and ultimately the pace of the economic recovery."My view is that house prices might have bottomed in some non-bubble areas, and also in some low end bubble areas with high foreclosure rates, however I expect further price decline in many mid-to-high end bubble areas.
Thursday, November 19, 2009
More on FHA Loans
by Calculated Risk on 11/19/2009 11:39:00 PM
David Streitfeld at the NY Times adds some color: Easy Loans in Expensive Areas
In January, Mike Rowland was so broke that he had to raid his retirement savings to move [to San Francisco] from Boston.Hopefully this will work out for Mr. Rowland and friends, but now for the chilling quote:
A week ago, he and a couple of buddies bought a two-unit apartment building for nearly a million dollars. They had only a little cash to bring to the table but, with the federal government insuring the transaction, a large down payment was not necessary.
“It was kind of crazy we could get this big a loan,” said Mr. Rowland, 27. “If a government official came out here, I would slap him a high-five.”
...
For decades, most F.H.A. loans were in low-cost states like Texas and Michigan. ... The Economic Stimulus Act of 2008 helped change that by temporarily doubling the maximum loan the F.H.A. insured, to $729,750. A two-unit property like the one bought by Mr. Rowland and his friends can be insured for up to $934,200.
Mr. Bedar, Mr. Rowland and the third partner in their property, Jordan Kurland, are all in the technology field, but their dreams of wealth do not feature stock options.This will end well ... (sorry for sarcasm)
“We’re banking on real estate,” said Mr. Kurland, 24. “Everyone expects prices to keep going up.”
Note: The MBA National Delinquency Survey showed 15.04% of FHA insured loans were delinquent as of the end of Q3, and another 3.32% were in the foreclosure process. The FHA Early Warning System shows that delinquencies are rising steadily on loans originated over the last two years. Not good.
On Negative T Bills
by Calculated Risk on 11/19/2009 09:30:00 PM
There was some buzz earlier today about short term T bill rates turning slightly negative. This happened last year too, but for different reasons ...
From the Financial Times: Short-term US interest rates turn negative
Short-term US interest rates turned negative on Thursday as banks frantically stockpiled government securities in order to polish their balance sheets for the end of the year.John Jansen at Across the Curve explains:
...
The scramble has been exacerbated by the fact that all leading US banks ... will this year close their books at the same time – at the end of December.
excerpted with permission
I do not speak to[o] often of the T bill market but yields in that market continue to collapse. In one recent conversation a market participant noted that bill yields are negative out to February. There are a couple of factors at work here. There is a massive wall of liquidity, a pile of cash which needs a home. That is driving yields lower.And more from John: More on Negative T Bills
Typically as the year end approaches clients tend to unwind profitable trades and reduce balance sheet. I think that some of that deleveraging process has created new piles of cash and that money needs a place to park.
Others are preparing to beautify their balance sheet by having some pristine government paper on the books over year end. Some of that trade has begun as investors purchase paper which will carry them into 2010.
In my closing post I noted that T bill rates are in negative territory and gave some reasons for that. Here is an excerpt from David Ader of CRT on that same topic;No worries ...
“We instead take our cue from activity in the financing markets, where year end is playing its hand – Jan bills are trading negative. The story here is not a new one as we saw bills negative at the end of the last quarter, but exacerbated by a more intense year end. We say that because 1) it’s clearly the talking point on funding desks, 2) EVERYONE has a Dec 31 year end as we have no investment banks any longer, and 3) as bank holding companies there’s a likelihood that former IBs, too, need to show cash in something other than a mattress.”
Another analyst whom I read suggested that an exacerbating factor was the maturity of some cash management bills which were not replaced.
Whatever the case, I am certain that the present circumstance is not an indicator of financial stress as plunging bill rates have been in the past.
States: Seriously Delinquent Mortgages vs. Unemployment Rate
by Calculated Risk on 11/19/2009 06:45:00 PM
Here is a scatter graph comparing the seriously delinquency rate for mortgage loans vs. unemployment rate for all states. The seriously delinquent rate include 90+ days delinquent loans, and loans in the foreclosure process for Q3 2009 (Source: MBA). Click on graph for larger image in new window.
There is a relationship between delinquency rates and the unemployment rate.
Florida really stands out because of state specific foreclosure laws. Arizona and Nevada also have higher than expected foreclosure rates - possibly because of high investor activity during the housing bubble.
As the unemployment rate continues to rise, the mortgage delinquency rate will increase too.
For more on the MBA National Delinquency Survey, see:
Mortgage Delinquencies and Foreclosures by Period Past Due
by Calculated Risk on 11/19/2009 03:49:00 PM
Click on graph for larger image in new window.
First, on the market ...
This graph is from Doug Short of dshort.com (financial planner): "Four Bad Bears".
Note that the Great Depression crash is based on the DOW; the three others are for the S&P 500.
Reader Yuri asked me if the number of 30 day delinquencies is decreasing. He was curious if the overall number of delinquencies is increasing because of the loan modifications and other actions that are limiting the outflow - but that that overall increase might be masking some improvement for the inflow of new delinquencies. This graph shows the delinquencies by time period (30, 60, 90 day, and in foreclosure) for all loans.\
The percentage of 30 and 60 day delinquencies have decreased slightly. However the rates are still near record levels.
For the 30 day bucket, there were 3.57% percent delinquent - not much lower than the high in Q1 of 3.77%. For 60 days, the rate was 1.67% - also below the high in Q1.
Clearly most of the increase was in the 90 day and in foreclosure buckets. And that is why the modification programs are so important. The second graph provides the same data for prime fixed rate mortgages. Both the 30 and 60 day buckets are still at record levels, although the rate of increase has slowed.
Since prime fixed rate mortgages account for about 2/3s of the mortgage market, a large portion of future foreclosures will probably be from these loans.
Hotel RevPAR off 15.7 Percent
by Calculated Risk on 11/19/2009 01:14:00 PM
From HotelNewsNow.com: New Orleans leads ADR, RevPAR declines in STR weekly numbers
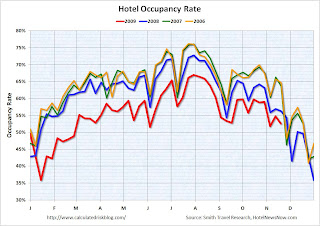
Overall, in year-over-year measurements, the industry’s occupancy fell 6.4 percent to end the week at 52.6 percent, ADR dropped 9.9 percent to US$95.86, and RevPAR decreased 15.7 percent to finish at US$50.47.
 Click on graph for larger image in new window.
This graph shows the occupancy rate by week for each of the last four years (2006 through 2009 labeled by start of month).
Notes: the scale doesn't start at zero to better show the change. Thanksgiving was late in 2008 (and will be late in 2009), so the dip doesn't line up with the previous years.
Data Source: Smith Travel Research, Courtesy of HotelNewsNow.com
This is a two year slump for the hotel industry. Although occupancy is off 6.4% compared to 2008, occupancy is off about 18% compared to 2006 and 2007.
Smith Travel Research released an updated hotel forecast 2011 can’t get here too soon .
Occupancy: 2009 will end at -8.8 percent (revised from -8.4 percent); 2010 figures will be down 0.2 percent (revised from -0.6 percent); and 2011 will be up 2.4 percent.Here is a PDF of the new forecast (free registration required)
Average daily rate: 2009 will close down 8.9 percent (revised from -9.7 percent); 2010 will be down 3.4 percent (unchanged from previous forecast); and 2011 will be up 5.5 percent.
“In the current cycle, it’s increasingly easy to predict supply and a little easier to predict demand,” [Mark Lomanno, STR’s president] said. “What is difficult is predicting rate growth ... how aggressive the industry will be in raising rates is virtually impossible to predict.”
...
Revenue per available room: 2009’s RevPAR will decline 17.0 percent (revised from 17.1 percent; it will drop 3.6 percent in 2010 (revised from -4.0 percent) before jumping 5.5 percent in 2011.
Supply: The number of guestrooms will end 2009 up 3.2 percent (revised from +3.0 percent); up 1.8 percent in 2010; and up 0.8 percent in 2011.
“The construction pipeline will mostly be built between now and early 2011,” Lomanno said.
...
Demand: Room demand in 2009 will be down 6.0 percent (revised from -5.5 percent) before turning positive in 2010 at +1.6 percent (revised from +1.3 percent). Demand will grow 3.2 percent in 2011, according to the STR forecast.
...
“Clearly commercial real estate will be a second shoe dropping in 2010,” [Randy Smith, STR’s co-founder and chairman] said. “That’s going to be a process that will hurt demand for the hotel industry. A huge chunk of demand for our industry will continue to be wiped out as long as the construction industry is on its back.”
The good news is the supply of new hotels is slowing sharply. The bad news is that means less construction employment - and also negatively impacts hotel occupancy.
MBA Forecasts Foreclosures to Peak in 2011
by Calculated Risk on 11/19/2009 11:08:00 AM
On the MBA conference call concerning the "Q3 2009 National Delinquency Survey", MBA Chief Economist Jay Brinkmann said this morning:
Note: Many more questions this time!
A few graphs ...
 Click on graph for larger image in new window.
The first graph shows the delinquency and in foreclosure rates for all prime loans.
Prime loans account for about 76% of all loans.
"We're all subprime now!" NOTE: Tanta first wrote this saying in 2007 in response to the 'contained to subprime' statements.
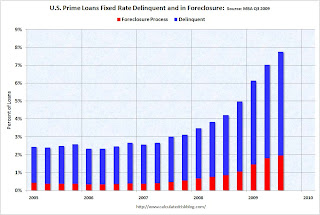
 The second graph shows just fixed rate prime loans (about two-thirds of all loans).
Prime ARMs have a higher delinquency rate than Prime FRMs, but the foreclosure crisis has now spread to Prime fixed rate loans.
Note that even in the best of times (with rapidly rising home prices in 2005), just over 2% of prime FRMs were delinquent or in foreclosure. However the cure rate was much higher back then since a delinquent homeowner could just sell their home.
 The third graph shows the delinquency and in foreclosure process rates for subprime loans.
 Although the increases have slowed, about 40% of subprime loans are delinquent or in foreclosure.
And a final comment: historically house prices do not bottom until after foreclosure activity peaks in a certain area. Since the subprime crisis delinquency rates might be peaking, it would not be surprising if prices are near a bottom in the low end areas. But in general I'd expect further declines in house prices - especially in mid-to-high end areas.


