by Calculated Risk on 11/23/2009 10:42:00 AM
Monday, November 23, 2009
Existing Home Sales Graphs
Here is another way to look at existing homes sales: Monthly, Not Seasonally Adjusted (NSA): This graph shows NSA monthly existing home sales for 2005 through 2009. For the fifth consecutive month, sales were higher in 2009 than in 2008.
And for the second straight month, sales in 2009 were higher than in 2007 (two years ago).
Of course many of these transactions in October were due to first-time homebuyers rushing to beat the expiration of the tax credit (that has now been extended). This has pushed sales far above the historical normal level; based on normal turnover, existing home sales would be in the 4.5 to 5.0 million SAAR range.  The second graph shows nationwide inventory for existing homes. According to the NAR, inventory decreased to 3.57 million in October from the upwardly revised 3.71 million in September. The all time record was 4.57 million homes for sale in July 2008. This is not seasonally adjusted.
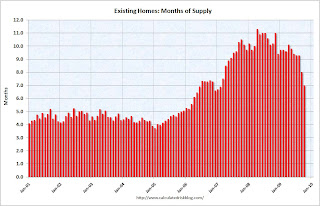
Typically inventory peaks in July or August, so some of this decline is seasonal. The third graph shows the 'months of supply' metric for the last six years.
Months of supply declined to 7.0 months in October.
Sales increased sharply, and inventory decreased, so "months of supply" declined. A normal market has under 6 months of supply, so this is still high - and especially considering sales were artificially boosted by the tax credit.
Existing Home Sales increase sharply in October
by Calculated Risk on 11/23/2009 10:00:00 AM
The NAR reports: Existing-Home Sales Record Another Big Gain, Inventories Continue to Shrink
Existing-home sales – including single-family, townhomes, condominiums and co-ops – surged 10.1 percent to a seasonally adjusted annual rate1 of 6.10 million units in October from a downwardly revised pace of 5.54 million in September, and are 23.5 percent above the 4.94 million-unit level in October 2008. Sales activity is at the highest pace since February 2007 when it hit 6.55 million.
...
Total housing inventory at the end of October fell 3.7 percent to 3.57 million existing homes available for sale, which represents a 7.0-month supply2 at the current sales pace, down from an 8.0-month supply in September. Unsold inventory totals are 14.9 percent below a year ago.
 Click on graph for larger image in new window.
This graph shows existing home sales, on a Seasonally Adjusted Annual Rate (SAAR) basis since 1993.
Sales in Oct 2009 (6.10 million SAAR) were 10.1% higher than last month, and were 23% higher than Oct 2008 (4.94 million SAAR).
I'll have more soon ...
Chicago Fed Index: "Economic activity leveled off in October"
by Calculated Risk on 11/23/2009 08:30:00 AM
From the Chicago Fed: Index shows economic activity leveled off in October
The Chicago Fed National Activity Index was –1.08 in October, down very slightly from –1.01 in September.
...
The index’s three-month moving average, CFNAI-MA3, decreased to –0.91 in October from –0.67 in September, declining for the first time in 2009. October’s CFNAI-MA3 suggests that growth in national economic activity remained below its historical trend.
 Click on table for larger image in new window.
This graph shows the Chicago Fed National Activity Index (three month moving average) since 1967. According to the Chicago Fed (update: earlier I excerpted from the entering recession section):
"When the economy is coming out of a recession, the CFNAI-MA3 moves significantly into positive territory a few months after the official NBER date of the trough. Specifically, after the onset of a recession, when the index first crosses +0.20, the recession has ended according to the NBER business cycle measures. The positive horizontal line in Figure 3 is at +0.2. The critical question is: how early does the CFNAI-MA3 reveal this turning point? For four of the last five recessions, this happened within five months of the business cycle trough."According to this index, it is still early to call the official recession over. The index is still fairly weak.
Sunday, November 22, 2009
WWII Slogan Makes a Comeback
by Calculated Risk on 11/22/2009 10:36:00 PM
Earlier posts ...
Summary and a Look Ahead (A busy week for housing data!)
Fed's Bullard Backs Extension of MBS Purchases
Possible Changes to FHA Insured Mortgages 
From the NY Times: Calming Sign of Troubled Past Appears in Modern Offices
To propel themselves through this economic downturn, media and advertising executives are turning to a phrase meant to soothe another troubled populace: the British during World War II.Image from Wikipedia.
“Keep calm and carry on,” a British government propaganda poster created in 1939, is now decorating offices.
Hey ... Keep Calm and Carry On!
Fed's Bullard Backs Extension of MBS Purchases
by Calculated Risk on 11/22/2009 07:26:00 PM
From the WSJ Real Time Economics: Fed’s Bullard: Asset Buying Efforts Should Remain Active (ht (Bob_in_MA)
“I have advocated to keep the asset purchase program open but at a very low level, and wait and see what happens, and as information comes in about the economy we can adjust that program while the federal funds rate remains at zero,” [Federal Reserve Bank of St. Louis President James] Bullard told Dow Jones Newswires in an interview Sunday ahead of a conference in New York. He added “no decision has been made” about the program’s fate.Bullard will be a voting member of the FOMC next year.
...
Citing the current level of the Fed’s overnight interest rate target, Bullard said “as long as we are at zero (percent) we’d be able to send signals to the markets about what we are thinking about the economy, and how much accommodation the economy needs at various points, by adjusting the asset purchases.”
Here are the slides from Bullard's speech today. Here are a few excerpts:
KEY PROBLEM: TOO BIG TO FAIL The crisis showed that large financial institutions worldwide were “too big to fail.” (TBTF) Really, “too big to fail quickly.” If we let large financial firms fail suddenly, global panic ensues. Again, these firms are not necessarily banks. Reform efforts must focus on getting this intolerable situation under control. TBTF is very costly to the macroeconomy as well as unfair. We need laser-like focus on this problem. ACTUAL PROPOSALS Proposals addressing TBTF: Systemic risk regulation: A council with the Fed having implementation responsibility. A resolution regime for large financial firms. Split up large firms. There are important global coordination issues. Difficulties in design suggests a “go slow” approach. The crisis will not soon be forgotten.
Possible Changes to FHA Insured Mortgages
by Calculated Risk on 11/22/2009 04:10:00 PM
Kenneth Harney at the SF Chronicle lists a few possible changes: FHA looking for ways to pump up its reserves. Harney lists four possible changes:
Currently, FHA charges an "up-front" mortgage insurance premium of 1.75 percent of the loan amount. Most borrowers roll that into their loan and finance it. FHA also charges an annual premium, paid in monthly installments, of either 0.5 percent or 0.55 percent, depending on the down payment. To rebuild reserves, FHA could ... raise the up-front premium to 2 percent or as high as the current statutory maximum of 2.25 percent. It could also raise the annual fee...
FHA is by far the most lenient and flexible player when it comes to evaluating applicants' creditworthiness.I think the most likely changes are higher insurance premiums, lower seller concessions, and tougher standards.
Summary and a Look Ahead
by Calculated Risk on 11/22/2009 12:15:00 PM
This will be a busy week for housing news starting with October existing home sales on Monday, Case-Shiller house prices on Tuesday, and New Home sales on Wednesday.
Existing home sales will probably be very high - close to a 5.8 million SAAR - because of the rush of first-time home buyers to receive the tax credit (before it was extended). This high level of activity is not good economic news - although some people might be fooled. The more important housing number will be New Home sales on Wednesday.
In other economic news, the Q3 GDP revision will be released on Tuesday, and the October Personal Income and Spending report will be released Wednesday.
Also the Q3 FDIC Quarterly Banking Report will probably be released this week. This report will likely show close to 500 problem banks at the end of Q3 (the Unofficial Problem Bank list is up to 513 banks), and the report will also show that the Deposit Insurance Fund (DIF) was at zero or negative. Note: this doesn't mean the FDIC is "bankrupt" or even out of cash - the DIF balance includes reserves against future losses.
And a summary ...
The increase in October was mostly a rebound from the decline in September.
 Click on graph for larger image in new window.
This graph shows retail sales since 1992. This is monthly retail sales, seasonally adjusted (total and ex-gasoline).
This shows that retail sales fell off a cliff in late 2008, and appear to have bottomed, but at a much lower level.
The red line shows retail sales ex-gasoline and shows there has been little increase in final demand.
 This graph shows Capacity Utilization. This series has increased for four straight months, and is up from the record low set in June (the series starts in 1967).
From the Fed: Industrial production and Capacity Utilization
Note: y-axis doesn't start at zero to better show the change.
This is just one month, but the recovery in industrial production slowed in October.
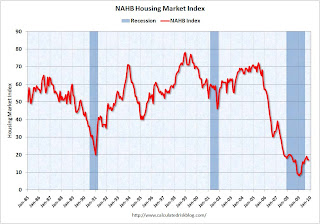
 This graph shows the builder confidence index from the National Association of Home Builders (NAHB).
The housing market index (HMI) was at 17 in November. October was revised down from 18 to 17. The record low was 8 set in January. This is very low - and this is what I've expected - a long period of builder depression.
Note: any number under 50 indicates that more builders view sales conditions as poor than good.
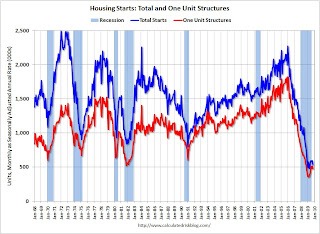
 Total housing starts were at 529 thousand (SAAR) in October, down 10.6% from the revised September rate, and up from the all time record low in April of 479 thousand (the lowest level since the Census Bureau began tracking housing starts in 1959). Starts had rebounded to 590 thousand in June, and have move sideways (or down) for five months.
Single-family starts were at 476 thousand (SAAR) in October, down 6.8% from the revised September rate, and 33 percent above the record low in January and February (357 thousand). Just like for total starts, single-family starts have been at this level for five months.
And some other economic stories
 This graph shows the delinquency and 'in foreclosure' rates for all prime mortgage loans. Prime loan delinquencies are clearly a growing problem.
MBA Chief Economist Jay Brinkmann said he expects the unemployment rate to peak in Q1 or Q2 2010, and delinquencies to peak sometime after the unemployment rate peaks. He now expects foreclosures to peak in early 2011 because a longer trailing effect than usual as the unemployment rate stays fairly high, and prime borrowers hang on before defaulting.
Bank Failures
The FDIC closed one bank on Friday, bringing the total for 2009 to 124.
Best wishes to all.
CRE Owners Seeking Property Tax Relief
by Calculated Risk on 11/22/2009 09:34:00 AM
From Carolyn Said at the San Francisco Chronicle: S.F. commercial properties seek tax relief
Landmark skyscrapers, signature hotels and upscale retailers glitter in the San Francisco skyline and enhance its cachet. But with commercial real estate slumping, they soon may subtract badly needed cash from the city's coffers.This is another impact of the CRE bust. I would think the city would have had a large budget surplus when property values - and property taxes - were soaring.
...
Collectively, those office towers, hotels, shopping centers and apartment buildings have an assessed value of $21.25 billion - but their owners say they're worth about half that amount. If those claims stand, that could wipe $115.78 million off the property taxes the city collects.
...
The potential property tax reductions come at the worst possible time for a city already grappling with budget cuts and deficits. San Francisco's controller warned last week that the city faces a potential half-billion-dollar deficit in its next fiscal year.
Saturday, November 21, 2009
More on Strategic Defaults
by Calculated Risk on 11/21/2009 09:22:00 PM
From Lew Sichelman at the LA Times: Owners' willingness to 'strategically default' on loans depends largely on how far underwater they are (ht Ann)
Most of the LA Times article is based on the paper by Guiso, Sapienza and Zingales that I covered in June: Moral and Social Constraints to Strategic Default on Mortgages (pdf)
Sichelman adds some comments from real estate agents on the ethics of strategic defaults:
Nellie Arrington of Long & Foster Real Estate in Columbia, Md., says it is "morally wrong, legally wrong and just plain wrong" for an owner to walk away from a mortgage he can afford simply because the balance exceeds the value of the underlying property.And on the other side:
Bob Hunt of Keller Williams O.C. Coastal Realty in San Clemente says the moral duty to protect your family outweighs the moral duty to repay the loan.
"Promise keeping is not the highest moral value," said Hunt, who before his real estate career taught ethics and logic at the University of Redlands. "If I promised to lend you my gun and you are now in a clearly dangerous psychotic stage, breaking my promise would be the right thing to do, not the wrong thing."


