by Calculated Risk on 11/25/2009 10:14:00 PM
Wednesday, November 25, 2009
Housing: A Weak Start to November
A short excerpt from the WSJ Developments: Think Twice About Cheering New Home Sales
Already, builders report weak November traffic. One private builder in Raleigh, N.C. - long considered a strong market because of tech and higher-education employers - reports no shoppers in the first week, according to John Burns Real Estate Consulting.I've heard similar reports from real estate agents that the first two weeks of November were exceptionally weak, but that the phones started ringing again once the word spread that the tax credit had been extended.
I wouldn't be surprised by a dip in New home sales in November - although existing home sales will probably still be fairly strong from people buying in September (existing home sales are reported at the close of escrow).
Jim the Realtor Interviews a Real Estate Flipper
by Calculated Risk on 11/25/2009 07:08:00 PM
Jim shows a property and interviews the investor. The investor recently bought the property for $590,000 on the court house steps, and sold it fairly quickly for $685,000.
Bankruptcy Filings Increase 34 Percent
by Calculated Risk on 11/25/2009 05:10:00 PM
From the U.S. Courts: Bankruptcy Filings Up 34 Percent over Last Fiscal Year
Bankruptcy cases filed in federal courts for fiscal year 2009 totaled 1,402,816, up 34.5 percent over the 1,042,993 filings reported for the 12-month period ending September 30, 2008, according to statistics released today by the Administrative Office of the U.S. Courts.
The federal Judiciary’s fiscal year is the 12-month period ending September 30. The bankruptcies reported today are for October 1, 2008 through September 30, 2009.
...
For the 12-month period ending September 30, 2009, business filings totaled 58,721, up 52 percent from the 38,651 business filings in the 12-month period ending September 30, 2008. Non-business filings totaled 1,344,095, up 34 percent from the 1,004,342 non-business bankruptcy filings in September 2008.
 Click on graph for larger image in new window.
 This graph shows the bankrutpcy filings over the last year per 1,000 population by states and territories.
Nevada makes sense with close to 70% of homeowners underwater. And Michigan is the state with the highest unemployment rate, and a large percentage of homeowners underwater. But I'm not sure why Tennessee is #2.
Ratio of Existing to New Home Sales
by Calculated Risk on 11/25/2009 03:26:00 PM
Here is more on the "distressing gap" between existing and new home sales.
The following graph shows the ratio of existing home sales divided by new home sales through October. Click on graph for larger image in new window.
This ratio has increased again to a new all time high.
The ratio of existing to new home sales increased at first because of the flood of distressed sales. This kept existing home sales elevated, and depressed new home sales since builders couldn't compete with the low prices of all the foreclosed properties.
The recent increase in the ratio was due primarily to the timing of the first time homebuyer tax credit (before the extension). New home sales are counted when the contract is signed, and usually before construction begins. So to close before the original Dec 1st deadline, the contract had to be signed early this Summer (that might explain the dip in the ratio earlier this year).
Existing home sales are counted when escrow closes, and escrow usually takes less than 60 days. So the recent surge in sales were boosted by buyers rushing to beat the tax credit. And this has pushed the ratio to a new record. The second graph shows the same information with existing home sales (left axis), and new home sales (right axis). This is updated through the October data released this morning.
Although distressed sales will stay elevated for some time, I expect this gap to eventually close.
The ratio could decline because of an increase in new home sales, or a decrease in existing home sales - I expect a combination of both.
MBA: Mortgage Applications Decrease, Rates Fall Slightly
by Calculated Risk on 11/25/2009 12:38:00 PM
I skipped the MBA market index earlier ...
The MBA reports: Mortgage Applications Decrease in Latest MBA Weekly Survey
The Market Composite Index, a measure of mortgage loan application volume, decreased 4.5 percent on a seasonally adjusted basis from one week earlier. ...Note: This is the lowest contract interest rate since mid-May.
The Refinance Index decreased 9.5 percent from the previous week and the seasonally adjusted Purchase Index increased 9.6 percent from one week earlier.
...
The average contract interest rate for 30-year fixed-rate mortgages decreased to 4.82 percent from 4.83 percent, with points increasing to 1.19 from 1.18 (including the origination fee) for 80 percent loan-to-value (LTV) ratio loans.
 Click on graph for larger image in new window.
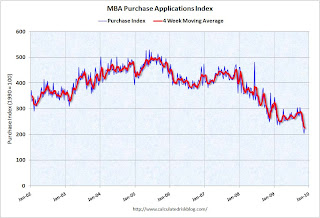
This graph shows the MBA Purchase Index and four week moving average since 2002.
In the past, the MBA index was predictive of future sales, but it has been questionable for some time. The increase in 2007 was due to the method used to construct the index: a combination of lender failures, and borrowers filing multiple applications pushed up the index in 2007 even though activity was actually declining.
Recently there has been a substantial number of cash buyers, so the MBA index missed the strength of the recent existing home sales increase. Still the recent plunge in the 4 week moving average of the purchase index is probably worth watching.
New Home Sales in October
by Calculated Risk on 11/25/2009 10:00:00 AM
The Census Bureau reports New Home Sales in October were at a seasonally adjusted annual rate (SAAR) of 430 thousand. This is an increase from the revised rate of 405 thousand in September (revised from 402 thousand). Click on graph for larger image in new window.
The first graph shows monthly new home sales (NSA - Not Seasonally Adjusted).
Note the Red columns for 2009. In October 2009, 35 thousand new homes were sold (NSA); the record low was 29 thousand in October 1981; the record high for October was 105 thousand in 2005. This is the 6th lowest sales for October since the Census Bureau started tracking sales in 1963.
Sales in October 2009 were above October 2008 (32 thousand). This is the first year over same month increase since October 2005. The second graph shows New Home Sales vs. recessions for the last 45 years. New Home sales fell off a cliff, but are now 31% above the low in January.
Sales of new one-family houses in October 2009 were at a seasonally adjusted annual rate of 430,000 ... This is 6.2 percent (±17.6%) above the revised September rate of 405,000 and is 5.1 percent (±14.9%) above the October 2008 estimate of 409,000.And another long term graph - this one for New Home Months of Supply.
 There were 6.7 months of supply in October - significantly below the all time record of 12.4 months of supply set in January.
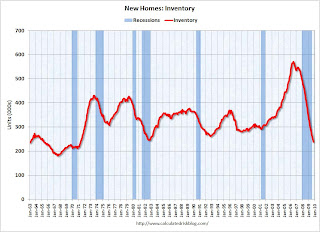
The seasonally adjusted estimate of new houses for sale at the end of October was 239,000. This represents a supply of 6.7 months at the current sales rate.
 The final graph shows new home inventory.
 Note that new home inventory does not include many condos (especially high rise condos), and areas with significant condo construction will have much higher inventory levels.
Months-of-supply and inventory have both peaked for this cycle, and sales have probably bottomed too. New home sales are far more important for the economy than existing home sales, and new home sales will remain under pressure until the overhang of existing housing inventory declines much further.
I'll have more later ...
October PCE and Saving Rate
by Calculated Risk on 11/25/2009 08:48:00 AM
From the BEA: Personal Income and Outlays, October 2009
Personal income increased $30.1 billion, or 0.2 percent, and disposable personal income (DPI) increased $45.7 billion, or 0.4 percent, in October, according to the Bureau of Economic Analysis. Personal consumption expenditures (PCE) increased $68.3 billion, or 0.7 percent.
...
Real PCE -- PCE adjusted to remove price changes -- increased 0.4 percent in October, in contrast to a decrease of 0.7 percent in September.
...
Personal saving -- DPI less personal outlays -- was $490.3 billion in October, compared with $510.4 billion in September. Personal saving as a percentage of disposable personal income was 4.4 percent in October, compared with 4.6 percent in September.
 Click on graph for large image.
This graph shows the saving rate starting in 1959 (using a three month centered average for smoothing) through the October Personal Income report. The saving rate was 4.4% in October.
I expect the saving rate to continue to rise - possibly to 8% or more - slowing the growth in PCE.
The following graph shows real Personal Consumption Expenditures (PCE) through October (2005 dollars). Note that the y-axis doesn't start at zero to better show the change.
 The quarterly change in PCE is based on the change from the average in one quarter, compared to the average of the preceding quarter.
The colored rectangles show the quarters, and the blue bars are the real monthly PCE.
Note that PCE in Q3 was distorted by the cash-for-clunkers program (especially August). Just using the October numbers, PCE would increase at about a 2.6% annualized rate in Q4. In general PCE growth will probably be below normal well into 2010 as households continue to repair their balance sheets.
Weekly Initial Unemployment Claims Decline Sharply
by Calculated Risk on 11/25/2009 08:30:00 AM
The DOL reports on weekly unemployment insurance claims:
In the week ending Nov. 21, the advance figure for seasonally adjusted initial claims was 466,000, a decrease of 35,000 from the previous week's revised figure of 501,000 [revised from 505,000]. The 4-week moving average was 496,500, a decrease of 16,500 from the previous week's revised average of 513,000.
...
The advance number for seasonally adjusted insured unemployment during the week ending Nov. 14 was 5,423,000, a decrease of 190,000 from the preceding week's revised level of 5,613,000.
 Click on graph for larger image in new window.
This graph shows the 4-week moving average of weekly claims since 1971.
The four-week average of weekly unemployment claims decreased this week by 16,500 to 496,500. This is the lowest level since last November.
This is good news - although the level is still high suggesting continuing job losses in November.
Tuesday, November 24, 2009
ATA Truck Tonnage Index Declines in October
by Calculated Risk on 11/24/2009 09:37:00 PM
From the American Trucking Association: ATA Truck Tonnage Index Dipped 0.2 Percent in October Click on graph for slightly larger image in new window.
The American Trucking Associations’ advance seasonally adjusted (SA) For-Hire Truck Tonnage Index decreased 0.2 percent in October, following a 0.3 percent contraction in September. The latest decline lowered the SA index to 103.6 (2000=100) from the revised 103.8 in September. ...The economy fell off a cliff in September
Compared with October 2008, SA tonnage fell 5.2 percent, which was the best year-over-year showing since November 2008. In September, the index was down 7.3 percent from a year earlier.
ATA Chief Economist Bob Costello said that the latest reading reflects an economic recovery that is still trying to gain balance, although it is on more solid ground than a year ago. “Repeating what I said last month, the trucking industry should not be alarmed by the small decreases in September and October,” Costello noted. “The economy is behaving as expected, with starts and stops. This is being reflected in truck tonnage, as well as most economic indicators.” He reiterated that the industry should remain prepared for ups and downs in the months ahead, but the general trend should be modest improvement. “Since consumer spending and manufacturing are not surging, trucking shouldn’t expect robust growth either. However, both retail sales and manufacturing output are exhibiting mild upward trend lines, which is the path I expect truck freight to take.”
...
Trucking serves as a barometer of the U.S. economy, representing nearly 69 percent of tonnage carried by all modes of domestic freight transportation, including manufactured and retail goods.
Philly Fed State Coincident Indicators
by Calculated Risk on 11/24/2009 06:59:00 PM
So much data, so little time ... just catching up. This was released earlier today: Click on map for larger image.
Here is a map of the three month change in the Philly Fed state coincident indicators. Thirty seven states are showing declining three month activity. The index increased in 12 states, and was unchanged in 1.
Here is the Philadelphia Fed state coincident index release for October.
In the past month, the indexes increased in 15 states (Kansas, Massachusetts, Michigan, Minnesota, Montana, North Carolina, New Hampshire, New Jersey, Ohio, Oregon, Rhode Island, Tennessee, Virginia, Vermont, and West Virginia), decreased in 27, and remained unchanged in eight (Arkansas, Colorado, Florida, Iowa, Indiana, Maine, Missouri, and Nevada) for a one month diffusion index of -24. Over the past three months, the indexes increased in 12 states (Indiana, Massachusetts, Minnesota, Montana, North Carolina, New Hampshire, Ohio, South Dakota, Tennessee, Virginia, Vermont, and West Virginia), decreased in 37, and remained unchanged in one (Idaho) for a three-month diffusion index of -50.
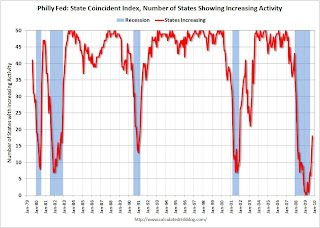
 The second graph is of the monthly Philly Fed data of the number of states with one month increasing activity. Most of the U.S. was has been in recession since December 2007 based on this indicator.
Note: this graph includes states with minor increases (the Philly Fed lists as unchanged).
Although the number of states in recession has been declining, a majority of states still showed declining activity in October.


