by Calculated Risk on 12/23/2009 10:00:00 AM
Wednesday, December 23, 2009
New Home Sales Decrease Sharply in November
The Census Bureau reports New Home Sales in November were at a seasonally adjusted annual rate (SAAR) of 355 thousand. This is a sharp decrease from the revised rate of 400 thousand in October (revised down from 430 thousand).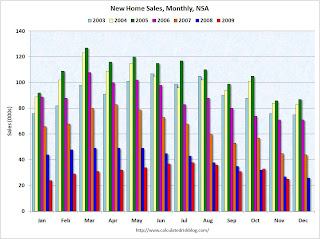 Click on graph for larger image in new window.
The first graph shows monthly new home sales (NSA - Not Seasonally Adjusted).
Note the Red columns for 2009. In November 2009, a record low 25 thousand new homes were sold (NSA); the previous record low was 26 thousand in November 1966.
Sales in November 2009 were below November 2008 (27 thousand). 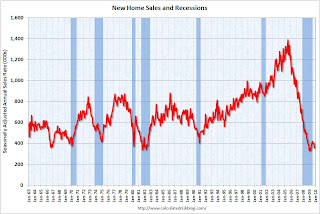 The second graph shows New Home Sales vs. recessions for the last 45 years. New Home sales fell off a cliff, but after increasing slightly, are now only 8% above the low in January.
Sales of new one-family houses in November 2009 were at a seasonally adjusted annual rate of 355,000 ... This is 11.3 percent (±11.0%) below the revised October rate of 400,000 and is 9.0 percent (±15.3%)* below the November 2008 estimate of 390,000.And another long term graph - this one for New Home Months of Supply.
 There were 7.9 months of supply in November - significantly below the all time record of 12.4 months of supply set in January.
The seasonally adjusted estimate of new houses for sale at the end of November was 235,000. This represents a supply of 7.9 months at the current sales rate.
 The final graph shows new home inventory.
 Note that new home inventory does not include many condos (especially high rise condos), and areas with significant condo construction will have much higher inventory levels.
Months-of-supply and inventory have both peaked for this cycle, and sales have probably bottomed too. New home sales are far more important for the economy than existing home sales, and new home sales will remain under pressure until the overhang of existing housing inventory declines much further.
Obviously this is a very weak report. I'll have more later ...
November PCE and Saving Rate
by Calculated Risk on 12/23/2009 08:30:00 AM
From the BEA: Personal Income and Outlays, November 2009
Personal income increased $49.7 billion, or 0.4 percent, and disposable personal income (DPI) increased $54.1 billion, or 0.5 percent, in November, according to the Bureau of Economic Analysis. Personal consumption expenditures (PCE) increased $47.9 billion, or 0.5 percent.
...
Real PCE -- PCE adjusted to remove price changes -- increased 0.2 percent in November, compared with an increase of 0.4 percent in October.
...
Personal saving -- DPI less personal outlays -- was $525.1 billion in November, compared with $516.7 billion in October. Personal saving as a percentage of disposable personal income was 4.7 percent in November, the same as in October.
 Click on graph for large image.
This graph shows the saving rate starting in 1959 (using a three month centered average for smoothing) through the November Personal Income report. The saving rate was 4.7% in November.
I expect the saving rate to continue to rise - possibly to 8% or more - slowing the growth in PCE.
The following graph shows real Personal Consumption Expenditures (PCE) through November (2005 dollars). Note that the y-axis doesn't start at zero to better show the change.
 The quarterly change in PCE is based on the change from the average in one quarter, compared to the average of the preceding quarter.
The colored rectangles show the quarters, and the blue bars are the real monthly PCE.
Using the two-month method for estimating Q4 PCE growth gives an estimate of just under 1%. However - note that PCE in August was distorted by the cash-for-clunkers program. So my guess is PCE growth in Q4 will be around 1.7%.
MBA: Mortgage Applications Decrease Sharply
by Calculated Risk on 12/23/2009 07:24:00 AM
The MBA reports: Mortgage Applications Decrease in Latest MBA Weekly Survey
The Market Composite Index, a measure of mortgage loan application volume decreased 10.7 percent on a seasonally adjusted basis from one week earlier. ...Rates are probably back above 5% now.
The Refinance Index decreased 10.1 percent from the previous week and the seasonally adjusted Purchase Index decreased 11.6 percent from one week earlier.
...
The average contract interest rate for 30-year fixed-rate mortgages remained flat at 4.92 percent, with points increasing to 1.23 from 1.08 (including the origination fee) for 80 percent loan-to-value (LTV) ratio loans.
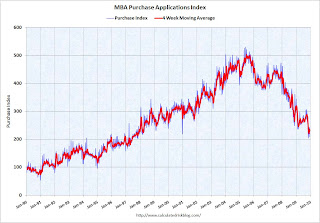 Click on graph for larger image in new window.
This graph shows the MBA Purchase Index and four week moving average since 1990.
Note: In the past the MBA index was somewhat predictive of future sales - and was a favorite indicator of Alan Greenspan, but it has been questionable for some time. The increase in 2007 was due to the method used to construct the index: a combination of lender failures, and borrowers filing multiple applications pushed up the index in 2007 even though activity was actually declining. Recently there has been a substantial number of cash buyers, so the MBA index missed the strength of the recent existing home sales increase.
However it is hard to ignore the sharp decline in purchase applications over the last couple of months.
Tuesday, December 22, 2009
Modifications: The Rentership Society
by Calculated Risk on 12/22/2009 11:28:00 PM
Two modification-renter related quotes: the first on modifications essentially turning homeowners into renters, and the second, a proposal from Dean Baker on making the renter-landlord relationship more formal.
From an article by Carolyn Said in the San Francisco Chronicle: 2009's mortgage modifications pretty minor
"The problem with affordability-only modification is that it essentially makes homeowners renters for the foreseeable future and locks them into their homes so they can't move elsewhere for better jobs." [said] Paul Leonard, director of the California office at the Center for Responsible Lending in Oakland.Exactly. Any modification that leaves a homeowner deep underwater is really converting the homeowner into a renter. And eventually most of those modifications will fail.
Dean Baker, co-director of the Center for Economic and Policy Research in Washington, suggest giving former homeowners the right to rent their home after foreclosure.There is no good solution, but at least we are acknowledging that many "homeowners" are really renters.
...
"If you give people the right to rent, it changes the logic from the lender's standpoint and makes foreclosure less attractive," he said. "Many lenders of their own volition will decide to work on loan modifications - otherwise they could be stuck with a renter for five to 10 years. It would shift the balance of power hugely in favor of the homeowner."
Financial Crisis Inquiry Commission set to Meet
by Calculated Risk on 12/22/2009 07:40:00 PM
From Tom Petruno: Financial-meltdown commission sets first hearings
The panel set up by Congress to tell us why the financial-system meltdown happened -- i.e., who and what to blame -- will hold its first hearings Jan. 13 and 14 in Washington.Maybe they will take suggestions and questions.
...
Congress is expecting a final report from the 10-member, bipartisan commission by Dec. 15, 2010.
My first suggestion is they start by interviewing - in private - the field examiners at the Fed, FDIC, OCC and OTS. There is no need to publicly embarrass any examiner. The various Inspector General reports on bank failures would provide a starting point (see Eric Dash's article in the NY Times: Post-Mortems Reveal Obvious Risk at Banks).
Ask the examiners what they saw and when - according to the Inspector General's reports, the field examiners were warning about lending problems in 2002 and 2003.
Follow the trail. Did this information generate warnings inside the organizations? If so, why wasn't action taken? Was the action blocked by political appointees? And how would the proposed regulatory reform lead to a better outcome?
And a quote from Eric Dash's article:
“Hindsight is a wonderful thing,” said Timothy W. Long, the chief bank examiner for the Office of the Comptroller of the Currency. “At the height of the economic boom, to take an aggressive supervisory approach and tell people to stop lending is hard to do.”If the lending was risky, telling them to stop was the regulators job. How does reform fix this?
The good news is Brooksley Born is on the commission, and I think she will do an excellent job.
Here is their website (under construction):
Mortgage Rates Move Higher
by Calculated Risk on 12/22/2009 04:34:00 PM
From CNBC: After Record Lows, Mortgage Rates Headed Up in 2010
"If you told me by the end of 2010 a 30-year rate was at 6 percent, that sounds about right," says Mark Zandi, chief economist at Moody's. "I don't think there's any question rates are headed up."Rates are definitely headed up right now, and with the Fed MBS purchase program scheduled to end in about three months, mortgage rates will probably increase some more. But I think the following estimate is way too high:
"The ending of the Fed program will definitely effect rates," says Mark Goldman, professor of real estate at San Diego State University. "So far, the Fed has not expressed interest in keeping the program going. That could raise rates by some 150-200 basis points."As I've noted before, I think the increase in rates will be in the 35-50 bps range relative to the 10 year Treasury yield when the Fed MBS purchase program ends. But here is an estimate much higher than mine!
Zandi also suggests there might be some Fed tightening next year due to inflation concerns and that could push up mortgage rates (I think this is unlikely), and also that the bond vigilantes might return next year because of concerns about the U.S. fiscal deficit and push up long rates (also unlikely in my view). Although not impossible, I don't think mortgage rates will rise to 6% next year - mostly because I think the recovery will be sluggish and choppy in 2010, and inflation will be benign (too much slack).
But the fear of higher rates is probably another reason for the surge in existing home sales, although I think the primary driver was the expected expiration of the first time home buyer tax credit.
More on Falling House Prices
by Calculated Risk on 12/22/2009 02:16:00 PM
Yesterday I mentioned that the Fed's favorite house price index showed prices fell in October.
However most people follow the Case-Shiller index, and the October Case-Shiller house price index will not be released until next Tuesday. Although Case-Shiller is an average of three months, I think that index will probably show a price decline too.
The following graph shows the LoanPerformance index (with and without foreclosures) and the Case-Shiller Composite 20 index in real terms (all adjusted with CPI less Shelter). Click on graph for larger image in new window.
It is interesting to look at the sharp decline in the index with foreclosures at the end of 2008 - this was what housing economist Tom Lawler described as "destickification" in the high foreclosure areas.
Notice the LoanPerformance price index without foreclosures (in red) is now at the lowest level since September 2002 in real terms (inflation adjusted).
This isn't like 2005 when prices were way out of the normal range by most measures - and it is possible that total prices have bottomed (although I think prices will fall further), but prices ex-foreclosures probably still have a ways to go - even with all the government programs aimed at supporting house prices.
Philly Fed State Coincident Indicators Show Improvement
by Calculated Risk on 12/22/2009 11:59:00 AM
Here is a little more positive data ... Click on map for larger image.
Here is a map of the three month change in the Philly Fed state coincident indicators. Twenty five states are showing declining three month activity. The index increased in 20 states, and was unchanged in 5.
Here is the Philadelphia Fed state coincident index release for November.
In the past month, the indexes increased in 26 states, decreased in 16, and remained unchanged in eight (Colorado, Idaho, Indiana, Louisiana, New Jersey, Oklahoma, Oregon, and Utah) for a one-month diffusion index of 20. Over the past three months, the indexes increased in 20 states, decreased in 25, and remained unchanged in five (California, Iowa, New Mexico, Pennsylvania, and Rhode Island) for a three-month diffusion index of -10.
 The second graph is of the monthly Philly Fed data of the number of states with one month increasing activity. Based on this indicator, most of the U.S. was in recession from about December 2007 through October 2009 - although the graph shows the recession ending in July 2009 (based on other data).
Note: this graph includes states with minor increases (the Philly Fed lists as unchanged).
A majority of states were showing increasing activity in November for the first time since the beginning of the recession.
More on Existing Home Sales
by Calculated Risk on 12/22/2009 10:54:00 AM
Earlier the NAR released the existing home sales data for November; here are a couple more graphs ... and a few comments.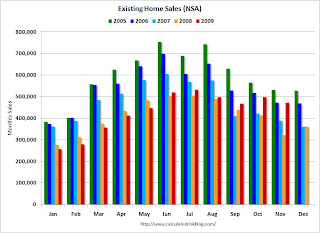 Click on graph for larger image in new window.
This graph shows NSA monthly existing home sales for 2005 through 2009 (see Red columns for 2009).
Sales (NSA) in November were much higher than in November 2007 and 2008, and were at the same level as November 2006.
Of course - as I noted earlier - many of these transactions in November were due to first-time homebuyers rushing to beat the expiration of the tax credit (that has now been extended).
Note: Existing home sales play an important role in the economy because they allow people to move for new job opportunies, or to move to larger or smaller homes for various reasons. It is the reason that people move that contributes to the economy; churning homes does nothing except generate some fees and commissions. Nothing has been added to the housing stock or the wealth of the nation.
The way to think of existing home sales is as grease for the economy. Once you have enough - probably around 4.5 to 5.0 million units per year - any extra is just a waste.
What matters for the economy are new home sales, housing starts and residential investment. And there has been little improvement in these key indicators - and there will not be any until the huge overhang of excess inventory is reduced.
This really shows up on the following graph: 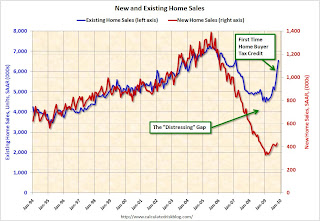 This graph shows existing home sales (left axis) through November, and new home sales (right axis) through October.
The initial gap was caused by the flood of distressed sales. This kept existing home sales elevated, and depressed new home sales since builders couldn't compete with the low prices of all the foreclosed properties.
The recent spike in existing home sales was due primarily to the first time homebuyer tax credit.
A few more comments:
Existing Home Sales up Sharply in November
by Calculated Risk on 12/22/2009 10:00:00 AM
The NAR reports: Another Big Gain in Existing-Home Sales as Buyers Respond to Tax Credit
Existing-home sales – including single-family, townhomes, condominiums and co-ops – rose 7.4 percent to a seasonally adjusted annual rate of 6.54 million units in November from 6.09 million in October, and are 44.1 percent higher than the 4.54 million-unit pace in November 2008. Current sales remain at the highest level since February 2007 when they hit 6.55 million.
...
Total housing inventory at the end of November declined 1.3 percent to 3.52 million existing homes available for sale, which represents a 6.5-month supply at the current sales pace, down from an 7.0-month supply in October.
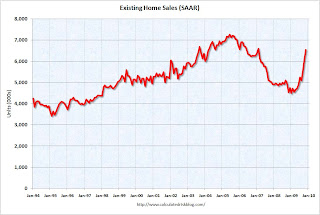 Click on graph for larger image in new window.
This graph shows existing home sales, on a Seasonally Adjusted Annual Rate (SAAR) basis since 1993.
Sales in Nov 2009 (6.54 million SAAR) were 7.4% higher than last month, and were 44% higher than Nov 2008 (4.54 million SAAR).
Of course many of the transactions in November were due to first-time homebuyers rushing to beat the initial expiration of the tax credit (that has now been extended). This has pushed sales far above the historical normal level; based on normal turnover, existing home sales would be in the 4.5 to 5.0 million SAAR range.
 The second graph shows nationwide inventory for existing homes. According to the NAR, inventory decreased to 3.52 million in November from 3.57 million in October. The all time record was 4.57 million homes for sale in July 2008. This is not seasonally adjusted.
Typically inventory peaks in July or August, so this decline is mostly seasonal.
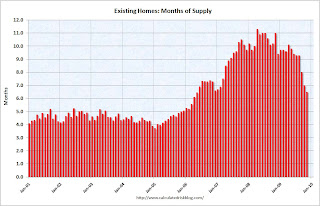 The third graph shows the 'months of supply' metric for the last six years.
Months of supply declined to 6.5 months in November.
A normal market has under 6 months of supply, so this is still high - and especially considering sales were artificially boosted by the tax credit. I'll have more soon ...


