by Calculated Risk on 1/01/2010 05:54:00 PM
Friday, January 01, 2010
WSJ: Five Key Housing Issues
Nick Timiraos at the WSJ writes: Five Key Housing Issues to Watch in 2010
Here is his list:
I reviewed the status of all these issues in Government Housing Support Update
Although all of these issues are important, I'd probably start from a different perspective:
1) What is the current supply situation and how will it be impacted in 2010?
2) What will happen to demand?
3) What will happen to prices?
As an example, the loan modifications and more loan recasts impact supply, whereas higher mortgage rates, tighter lending standards, and the end of the tax credit will all impact demand. I'll try to address these issues in a 2010 housing overview soon.
Impact of Census on Employment and Unemployment Rate
by Calculated Risk on 1/01/2010 01:02:00 PM
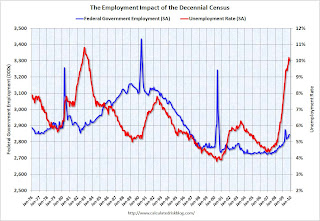
What will be the impact of the 2010 Census on employment? Click on graph for larger image in new window.
The first graph shows the impact of the decennial Census on Federal Government employment (Seasonally adjusted) and on the unemployment rate.
Note: left on right scales don't start at zero to better show the change.
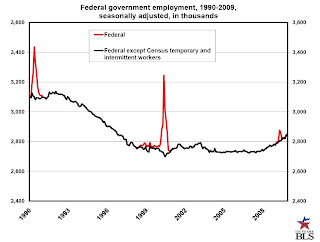
Every 10 years there is a large spike in Federal Government employment, but the Census has little impact on the unemployment rate. The second graph shows the monthly change in Federal government employment during the last two decennial census periods (1990 and 2000).
There was a surge in payroll employment in March, April and especially in May. And then almost all of the jobs were lost in the June through September period. We should expect a similar pattern this year.
Note: there are reports that the Census Bureau will hire up to 1.4 million people, however that represents some contingency planning, and includes a number of people already hired temporarily in 2009. We can probably expect a couple hundred thousand people added between January through April, and another 500 thousand or so in May. This could push the unemployment rate down slightly, but probably in the 0.1% to 0.2% range. The BLS provides a monthly report of Census hiring. This graph is from the BLS report and shows the historical impact of the Census on Federal Government employment.
There was a small spike in employment in April 2009, and currently the decennial census has little impact on employment. This will be something to check every month - especially from March through September.
Chicago PMI revised down, Treasury makes final TARP Bank Investments
by Calculated Risk on 1/01/2010 09:53:00 AM
A couple of stories that I missed yesterday ...
Dow Jones reports that the Chicago Institute for Supply Management revised down the Chicago PMI to 58.7 on Thursday from the announced reading of 60.0 on Wednesday. The most significant change was to the employment index that now shows contraction at 47.6 compared to the announced 51.2.
And the WSJ reports that the Treasury announced they made their final TARP investment in a bank: Treasury Ends TARP Bank Investments (ht jb)
The U.S. Treasury this week officially ended the bank recapitalization portion of its Troubled Asset Relief Program. ... A Treasury spokesman said [10 small banks] would be the last to receive capital under the effort ...
Thursday, December 31, 2009
Happy New Year
by Calculated Risk on 12/31/2009 11:16:00 PM
| Happy New Year! |
The first week of 2010 will be chock-full of data. Should be very interesting. And oh ... good riddance to the aughts!
From Tanta's sister Cathy ... A little "New Years Eve" Rock Blogging
Jim the Realtor: One Million is the new Two Million
by Calculated Risk on 12/31/2009 08:07:00 PM
Prices are still too high in some areas ... yeah, these people put half a million down - and the foreclosure auction is coming up.
Renters Win!
by Calculated Risk on 12/31/2009 05:14:00 PM
From USA Today: Apartment renters win as vacancy rate climbs (ht Brian)
Rents fell a record 3.5% in 2009 after factoring in freebies, according to MPF Research. MPF projects prices will fall an additional 2% next year ...Note: Reis reported the apartment vacancy rate at a 23 year high 7.8% at the end of Q3 2009, and the Census Bureau reported the total rental vacancy rate at a record 11.1%.
"I've been at this 35 years, and it's by far the worst I've seen it," says Jeff Cronrod of the American Apartment Owners Association.
Nationwide, apartment vacancy is 7.8%, up from 4.8% at the end of 2007, says MPF Vice President Greg Willett.
The article notes that the supply of rental units is growing as investors buy homes to rent for cash flow and some "homeowners who want to move but can't sell their houses because they're worth less than their mortgages are renting them out instead."
Hey, who does that remind you of? (hint)
Reader Poll Results: Economic Outlook for 2010
by Calculated Risk on 12/31/2009 03:15:00 PM
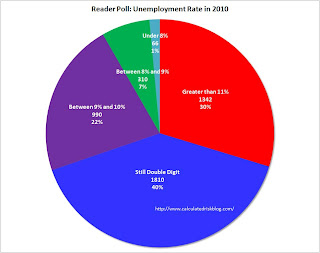
Here are the results of the reader poll. Thanks to the 4,518 people who participated! Click on graph for larger image in new window.
The first question was the outlook for GDP growth in 2010. Readers who participated in the poll tend to be pessimistic, with 57% expecting a double dip recession, and another 30% expecting real GDP growth to be below 2% in 2010.
Usually the economy grows very quickly after a severe recession. As an example, following the '48/'49 recession, the economy grew at a double digit growth rate for the first three quarters of the recovery. In the 2nd half of 1959, the economy grew at a 9.7% rate, and in the year following the '73/'75 recession, GDP increased 6.2%.
Since this was the most severe recession since the Great Depression, a normal recovery would probably be 8%+ real GDP growth for a year or so. That isn't going to happen. Even a 4% growth rate would have to be considered sluggish by historical standards.
I'll post more on the reasons for my outlook, but I think the U.S. will avoid a double dip recession, and 2010 GDP growth will be in the 2% to 3% range. The second question concerned the unemployment rate at the end of 2010 (December 2010).
Most poll participants (70%) are expecting the unemployment rate to be at or above 10% at the end of 2010. I think it might be close, but I agree with the majority on the unemployment rate (still double digits in Dec 2010). There will be a temporary positive impact from the 2010 Census, and I expect another stimulus package (labeled a "jobs package") to be announced in the next few months - and maybe that will push the rate down below double digits.
I'll have more in the next few days. Thanks again for participating! I hope most of us are too pessimistic.
Hotels: Worst Year Since Great Depression
by Calculated Risk on 12/31/2009 12:28:00 PM
In terms of the occupancy rate, 2009 was the worst year since the Great Depression (close to 55%). And last week was no exception with Smith Travel Research reporting the occupancy rate fell to 33.8 percent - the lowest weekly occupancy rate on record.
From HotelNewsNow.com: STR reports US performance for week ending 26 December
In year-over-year measurements, the industry’s occupancy fell 5.4 percent to end the week at 33.8 percent. Average daily rate dropped 8.0 percent to finish the week at US$85.78. Revenue per available room for the week decreased 13.0 percent to finish at US$29.02.
 Click on graph for larger image in new window.
This graph shows the occupancy rate by week for each of the last four years (2006 through 2009 labeled by start of month).
Note: Some of the holidays don't line up - especially at the end of the year.
Data Source: Smith Travel Research, Courtesy of HotelNewsNow.com (Note: They have a free daily email too for hotel news)
The end of the year can be a little confusing because of the holidays, and the next key weeks will be mid-to-late January to see if business travel is picking up in 2010.
Restaurant Index Shows Contraction in November
by Calculated Risk on 12/31/2009 10:20:00 AM
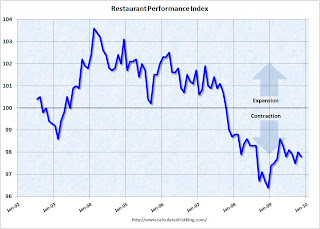
 Click on graph for larger image in new window.
Unfortunately the data for this index only goes back to 2002.
Note: Any reading below 100 shows contraction for this index. The index is a year-over-year index, so the headline index might be slow to recognize a pickup in business, but the underlying details suggests ongoing weakness.
From the National Restaurant Association (NRA): Restaurant Industry Outlook Remained Uncertain as the Restaurant Performance Index Declined for the Third Time in the Last Four Months
[T]he National Restaurant Association’s ... Restaurant Performance Index (RPI) ... stood at 97.8 in November, down 0.2 percent from its October level. In addition, the RPI remained below 100 for the 25th consecutive month, which signifies contraction in the index of key industry indicators.
“Although the RPI remained below 100 for the 25th consecutive month, which signals contraction, restaurant operators are cautiously optimistic that conditions will improve in the months ahead,” said Hudson Riehle, senior vice president of the Research and Knowledge Group for the Association. “Restaurant operators reported a positive six-month sales outlook for the first time in three months, and remained optimistic that the economy will improve during the next six months.”
...
The Current Situation Index, which measures current trends in four industry indicators (same-store sales, traffic, labor and capital expenditures), stood at 96.0 in November – down 0.5 percent from October and tied for its second-lowest level on record. In addition, November represented the 27th consecutive month below 100, which signifies contraction in the current situation indicators.
Restaurant operators reported negative same-store sales for the 18th consecutive month in November, with the overall results similar to the September and October performances. ...
Customer traffic also remained soft in November, as restaurant operators reported net negative traffic for the 27th consecutive month. ...
Along with soft sales and traffic levels, operators reported a dropoff in capital spending activity. Thirty-three percent of operators said they made a capital expenditure for equipment, expansion or remodeling during the last three months, down from 40 percent who reported similarly last month.
emphasis added
Weekly Initial Unemployment Claims Decline
by Calculated Risk on 12/31/2009 08:32:00 AM
Note: For fun, see the reader polls on the right sidebar for 2010 economic outlook. Polling ends today at 3 PM ET.
The DOL reports on weekly unemployment insurance claims:
In the week ending Dec. 26, the advance figure for seasonally adjusted initial claims was 432,000, a decrease of 22,000 from the previous week's revised figure of 454,000. The 4-week moving average was 460,250, a decrease of 5,500 from the previous week's revised average of 465,750.
...
The advance number for seasonally adjusted insured unemployment during the week ending Dec. 19 was 4,981,000, a decrease of 57,000 from the preceding week's revised level of 5,038,000.
 Click on graph for larger image in new window.
This graph shows the 4-week moving average of weekly claims since 1971.
The four-week average of weekly unemployment claims decreased this week by 5,500 to 460,250. This is the lowest level since September 2008.
The decline in initial claims is good news, although the 4-week average suggests continuing job losses. Also we have also to be careful because data can be volatile during the holidays.


